> ## Documentation Index
> Fetch the complete documentation index at: https://mw-docs.middleware.io/llms.txt
> Use this file to discover all available pages before exploring further.
# Cassandra
> Cassandra Integration - Setup & Installation Docs | Middleware
The Cassandra Database Integration provides seamless access to your database performance metrics and enables users to effortlessly visualize crucial insights in a single dashboard. This integration is useful for teams that want to visualize total compaction tasks over time, read/write latency, and storage resource availability.
This integration works by pulling metrics from the database through the Middleware Host Agent. Metrics are ingested by attaching a Java Management Extension (JMX) receiver to your Cassandra cluster and sending your telemetry data to Middleware.
This integration is only supported for users with the default `AllowAllAuthenticator` authentication permissions.
# Prerequisites
Middleware Host Agent (MW Agent) must be installed on your local machine. To install the MW Agent, see our [Installation Guide](https://docs.middleware.io/agent-installation/overview).
# Setup
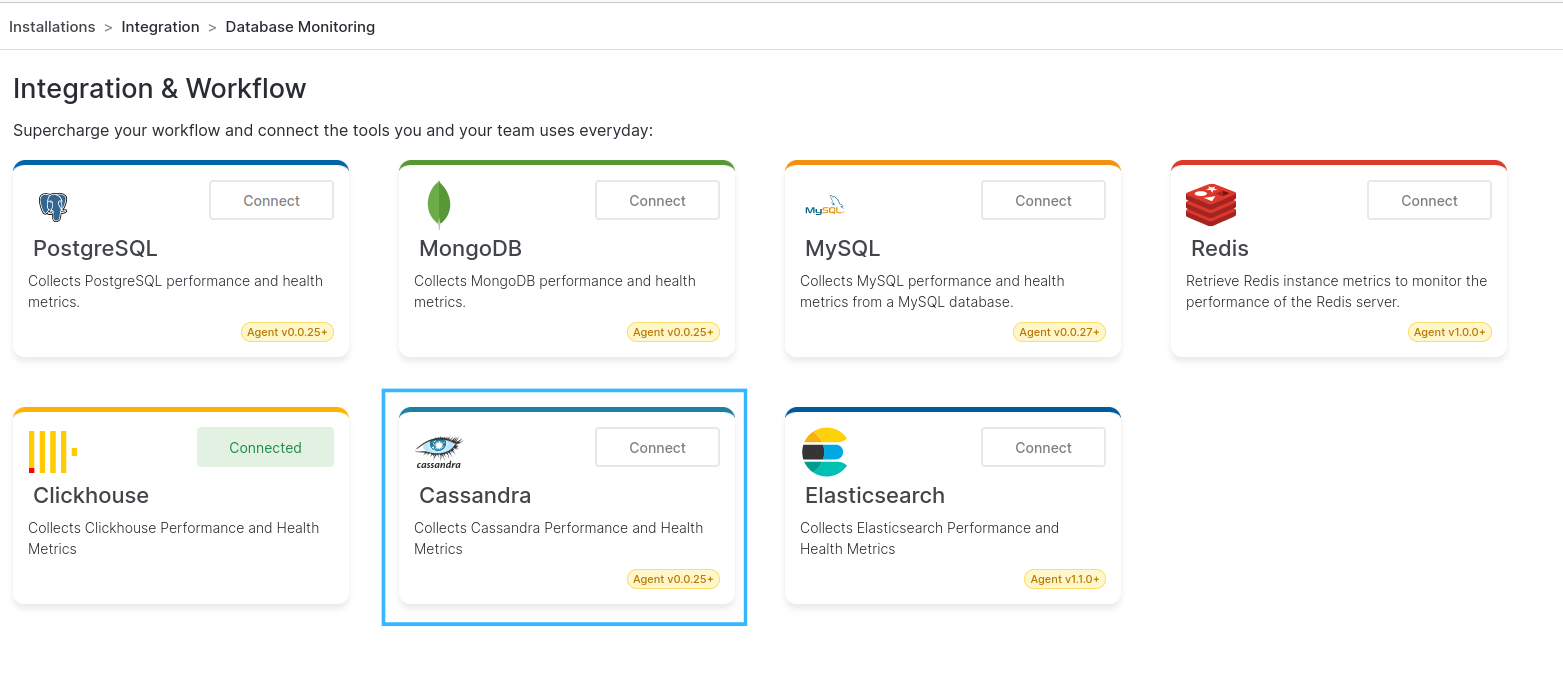
### Step 1: Access Integrations
Login to your Middleware account, navigate to the Installations page in the bottom left corner, select All Integrations and click Cassandra:
 ### Step 2: Connect Cassandra Instance
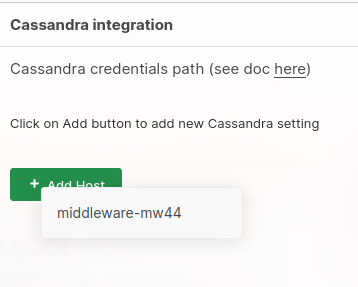
To access Cassandra metrics, choose a host to connect to your Cassandra Cluster:
Hosts will only show up in this list if they have a running Host Agent
### Step 2: Connect Cassandra Instance
To access Cassandra metrics, choose a host to connect to your Cassandra Cluster:
Hosts will only show up in this list if they have a running Host Agent
 ### Step 3: Configure Your Host
Configure your host to connect to the IP address and JMX port of your Cassandra Cluster:
### Step 3: Configure Your Host
Configure your host to connect to the IP address and JMX port of your Cassandra Cluster:
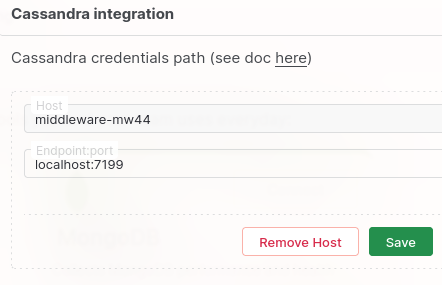 The default port for your Cassandra instance is `7199`
# Visualize Your Data
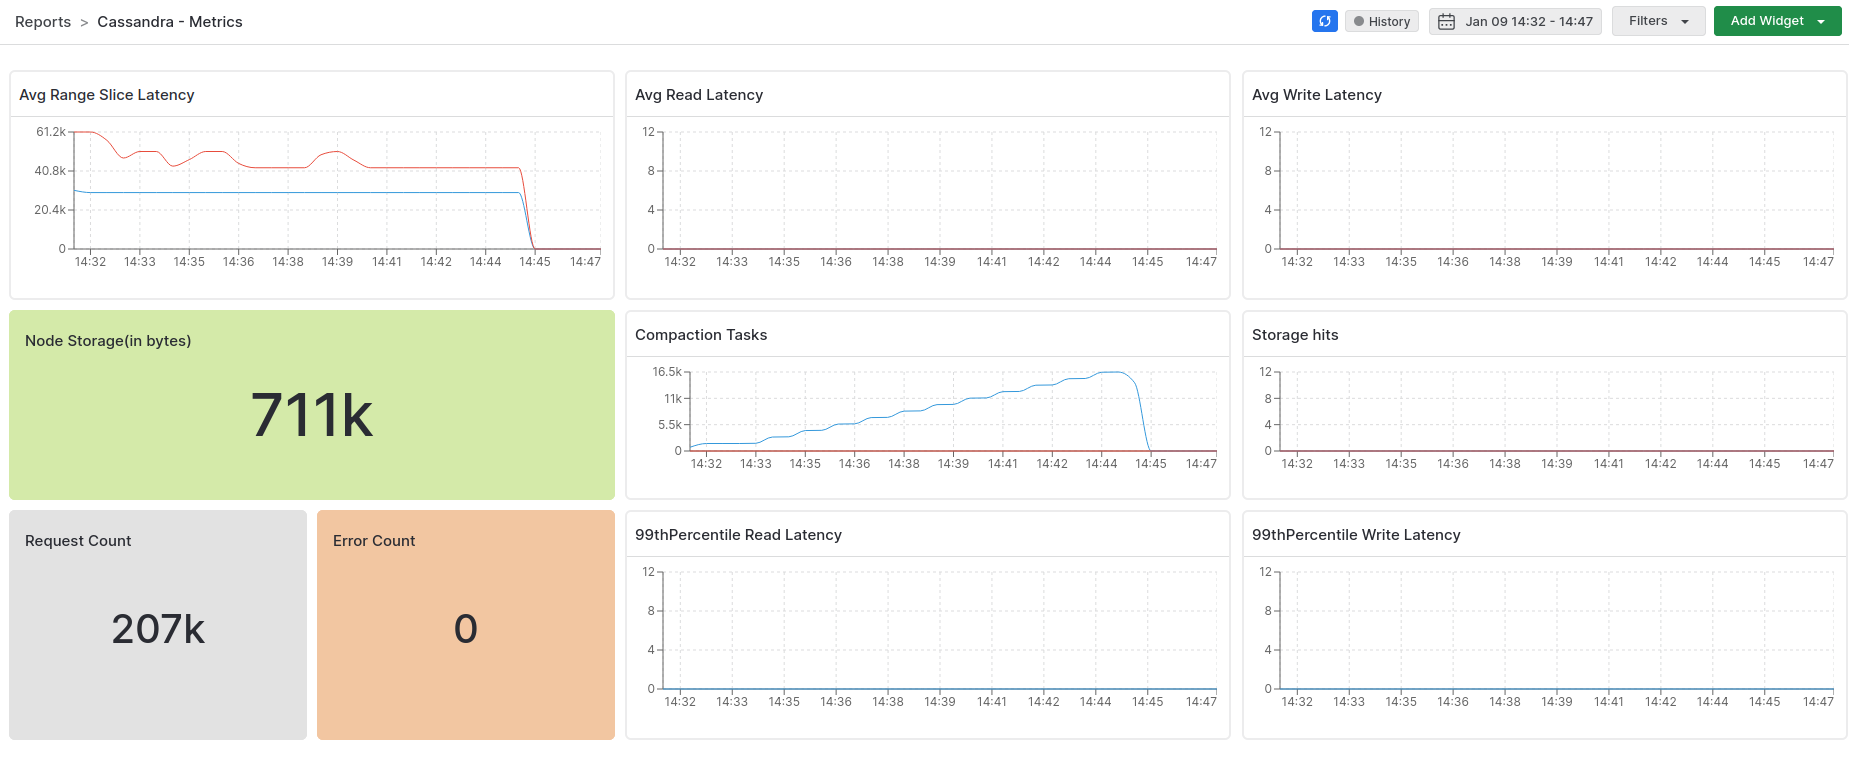
### Default Cassandra Dashboard
Quickly access your Cassandra data with Middleware’s default Cassandra dashboard. Navigate to the Dashboard Builder and select the ***Cassandra - Metrics*** Dashboard
The default port for your Cassandra instance is `7199`
# Visualize Your Data
### Default Cassandra Dashboard
Quickly access your Cassandra data with Middleware’s default Cassandra dashboard. Navigate to the Dashboard Builder and select the ***Cassandra - Metrics*** Dashboard
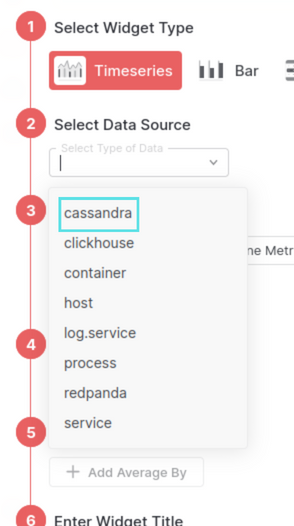
 ### Create Cassandra Widgets
Create your own widget from scratch. Navigate to the Dashboard Builder and select the dashboard you would like to create a widget in. Select Add New Widget and choose the ***cassandra*** data source.
### Create Cassandra Widgets
Create your own widget from scratch. Navigate to the Dashboard Builder and select the dashboard you would like to create a widget in. Select Add New Widget and choose the ***cassandra*** data source.
 Learn more about creating your own widgets and dashboards in the [Dashboard Builder](https://docs.middleware.io/workflow/custom-dashboard/build-custom-dashboard) section.
# Metrics Collected
| **Metric** | **Description** |
| :------------------------------------------------- | :--------------------------------------------------- |
| `cassandra.client.request.count` | Total count of client requests |
| `cassandra.client.request.error.count` | Count of errors that occurred during client requests |
| `cassandra.client.request.range_slice.latency.50p` | 50th percentile latency for range slice requests |
| `cassandra.client.request.range_slice.latency.99p` | 99th percentile latency for range slice requests |
| `cassandra.client.request.range_slice.latency.max` | Maximum latency for range slice requests |
| `cassandra.client.request.read.latency.50p` | 50th percentile latency for read requests |
| `cassandra.client.request.read.latency.99p` | 99th percentile latency for read requests |
| `cassandra.client.request.read.latency.max` | Maximum latency for read requests |
| `cassandra.client.request.write.latency.50p` | 50th percentile latency for write requests |
| `cassandra.client.request.write.latency.99p` | 99th percentile latency for write requests |
| `cassandra.client.request.write.latency.max` | Maximum latency for write requests |
| `cassandra.compaction.tasks.completed` | Count of completed compaction tasks |
| `cassandra.compaction.tasks` | Current count of compaction tasks |
| `cassandra.storage.load.count` | Count of storage loads |
| `cassandra.storage.total_hints.count` | Total count of hints stored |
| `cassandra.storage.total_hints.in_progress.count` | Count of hints currently in progress |
# Troubleshooting
If you do not see the Integrations Menu in Middleware, that means your account has not been granted `Installation` permissions. Contact your system administrator to add the `Installation` permission to your user role in Settings.
# Next Steps
* [How to Create Alerts](https://docs.middleware.io/workflow/alerting/setup-alert)
* [Dashboard Basics & Customization](https://docs.middleware.io/workflow/custom-dashboard/dashboard-builder-overview)
* [Custom Telemetry Ingestion](https://docs.middleware.io/open-telemetry/otel-getting-started)
* [Getting Started With Real User Monitoring (RUM)](https://docs.middleware.io/rum/rum-overview)
* [Data Ingestion APIs](https://docs.middleware.io/data-ingestion-apis/opentelemetry-metrics)
Need assistance or want to learn more about Middleware? Contact us at support\[at]middleware.io.
Learn more about creating your own widgets and dashboards in the [Dashboard Builder](https://docs.middleware.io/workflow/custom-dashboard/build-custom-dashboard) section.
# Metrics Collected
| **Metric** | **Description** |
| :------------------------------------------------- | :--------------------------------------------------- |
| `cassandra.client.request.count` | Total count of client requests |
| `cassandra.client.request.error.count` | Count of errors that occurred during client requests |
| `cassandra.client.request.range_slice.latency.50p` | 50th percentile latency for range slice requests |
| `cassandra.client.request.range_slice.latency.99p` | 99th percentile latency for range slice requests |
| `cassandra.client.request.range_slice.latency.max` | Maximum latency for range slice requests |
| `cassandra.client.request.read.latency.50p` | 50th percentile latency for read requests |
| `cassandra.client.request.read.latency.99p` | 99th percentile latency for read requests |
| `cassandra.client.request.read.latency.max` | Maximum latency for read requests |
| `cassandra.client.request.write.latency.50p` | 50th percentile latency for write requests |
| `cassandra.client.request.write.latency.99p` | 99th percentile latency for write requests |
| `cassandra.client.request.write.latency.max` | Maximum latency for write requests |
| `cassandra.compaction.tasks.completed` | Count of completed compaction tasks |
| `cassandra.compaction.tasks` | Current count of compaction tasks |
| `cassandra.storage.load.count` | Count of storage loads |
| `cassandra.storage.total_hints.count` | Total count of hints stored |
| `cassandra.storage.total_hints.in_progress.count` | Count of hints currently in progress |
# Troubleshooting
If you do not see the Integrations Menu in Middleware, that means your account has not been granted `Installation` permissions. Contact your system administrator to add the `Installation` permission to your user role in Settings.
# Next Steps
* [How to Create Alerts](https://docs.middleware.io/workflow/alerting/setup-alert)
* [Dashboard Basics & Customization](https://docs.middleware.io/workflow/custom-dashboard/dashboard-builder-overview)
* [Custom Telemetry Ingestion](https://docs.middleware.io/open-telemetry/otel-getting-started)
* [Getting Started With Real User Monitoring (RUM)](https://docs.middleware.io/rum/rum-overview)
* [Data Ingestion APIs](https://docs.middleware.io/data-ingestion-apis/opentelemetry-metrics)
Need assistance or want to learn more about Middleware? Contact us at support\[at]middleware.io.