> ## Documentation Index
> Fetch the complete documentation index at: https://mw-docs.middleware.io/llms.txt
> Use this file to discover all available pages before exploring further.
# Kafka
> Kafka Integration - Setup & Installation Docs | Middleware
The Kafka Integration offers real-time insights into your Kafka pipeline performance. Actively monitor your Kafka brokers, partitions, consumer groups, and JMX metrics in our default dashboard or with custom widgets.
For more information on the Kafka Integration, navigate to the [Kafka Demo Project](https://github.com/middleware-labs/integration-demo-projects/blob/master/kafka/kafka_auth_sasl_plaintext/README.md) repository.
# Prerequisites
Middleware Host Agent (MW Agent) `v 1.5.0+` must be installed on your local machine. To install the MW Agent, see our [Installation Guide](https://docs.middleware.io/agent-installation/overview).
# Setup
### Step 1: Download Jar File
Download the `opentlemetry-jmx-metrics.jar` file [here](https://github.com/open-telemetry/opentelemetry-java-contrib/releases/download/v1.33.0/opentelemetry-jmx-metrics.jar).
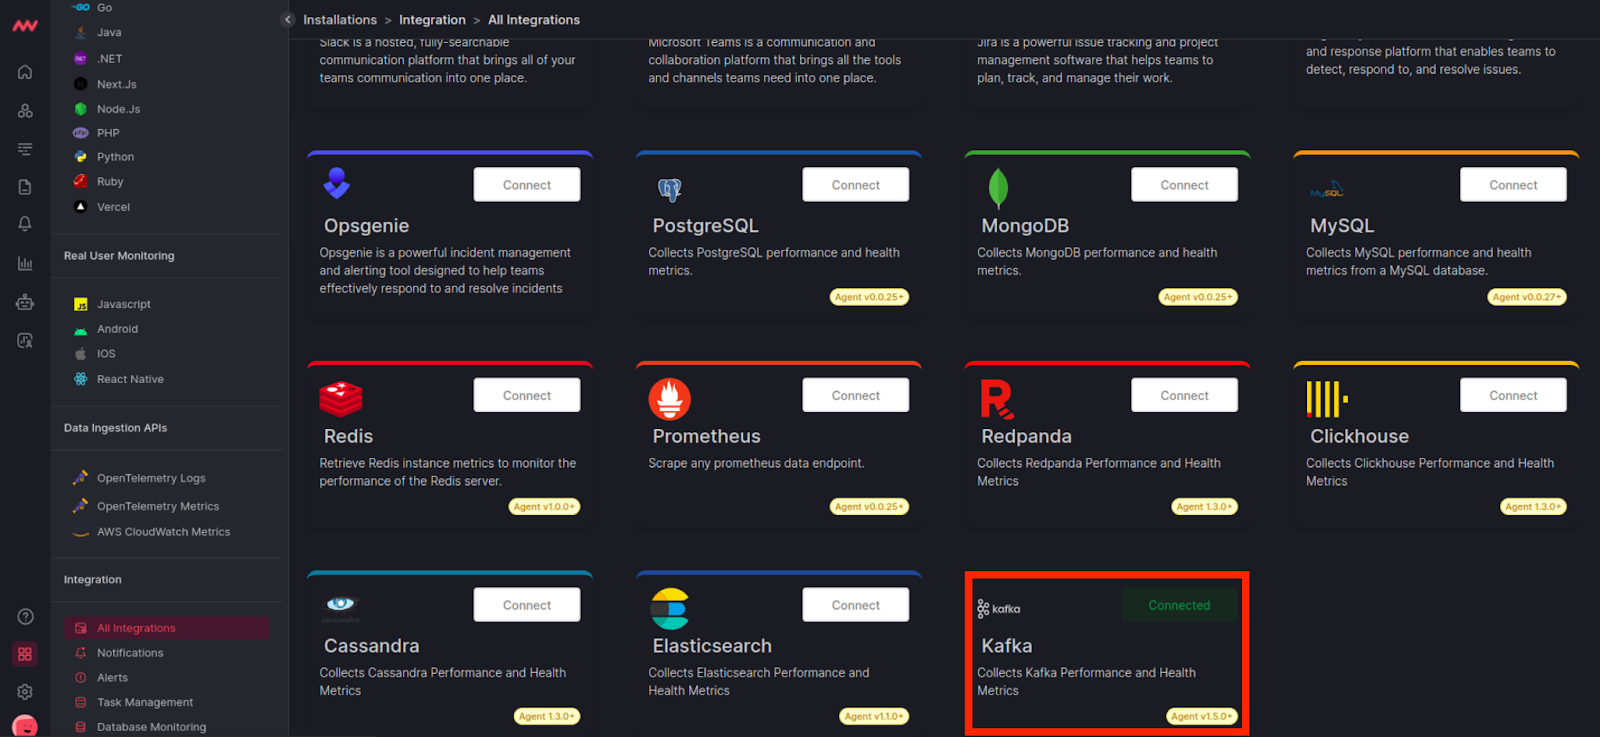
### Step 2: Access Integrations
Login to your Middleware account, navigate to the Kafka integration, and connect Kafka:
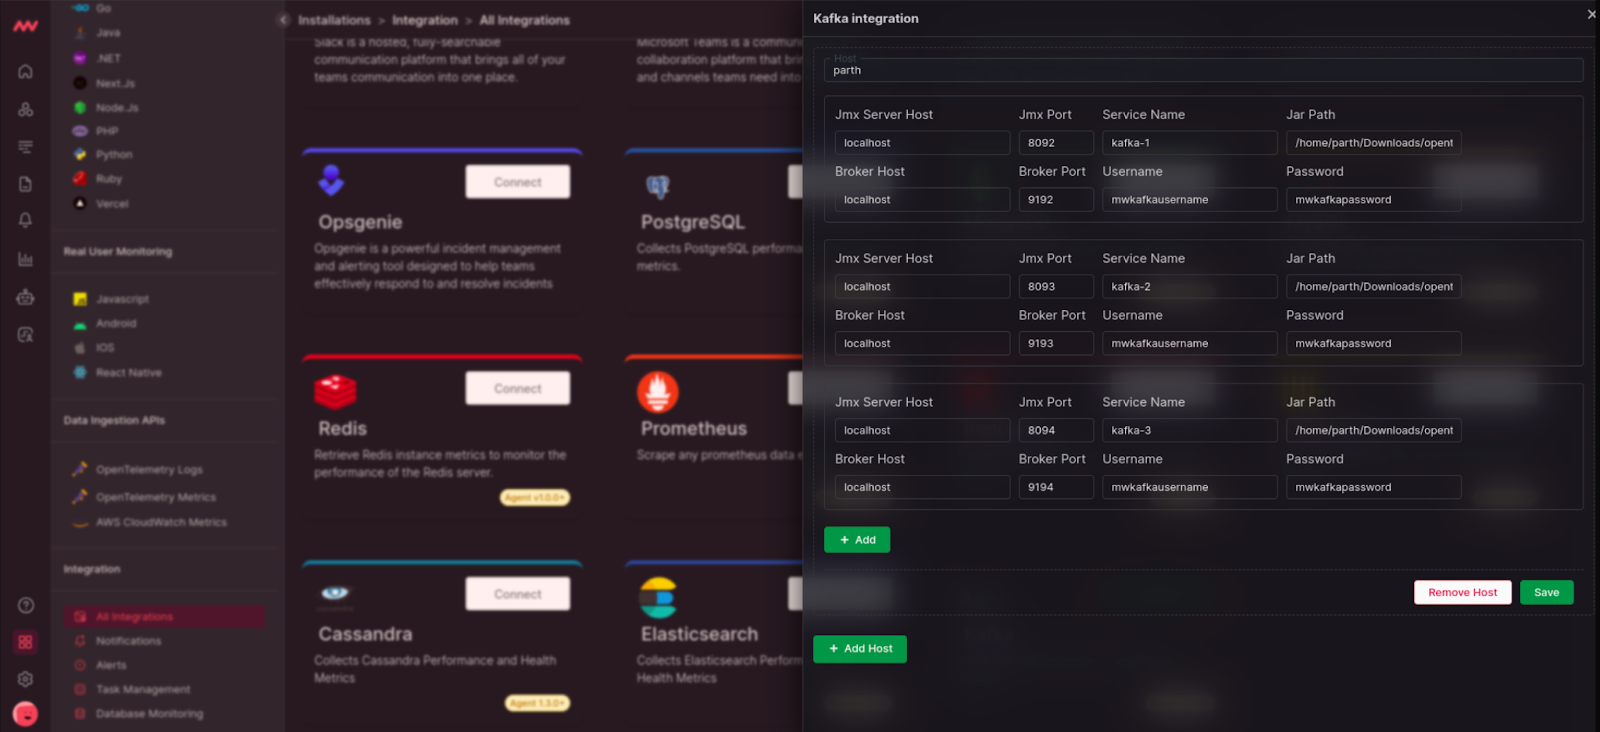
### Step 3: Add Kafka Host
Add your JMX Server and Broker Host configuration to instrument the Kafka Host:
For more information on each input field, navigate to the [Host Configuration Details](/integrations/kafka-integration#host-configuration-details) section.
# Visualize Your Data
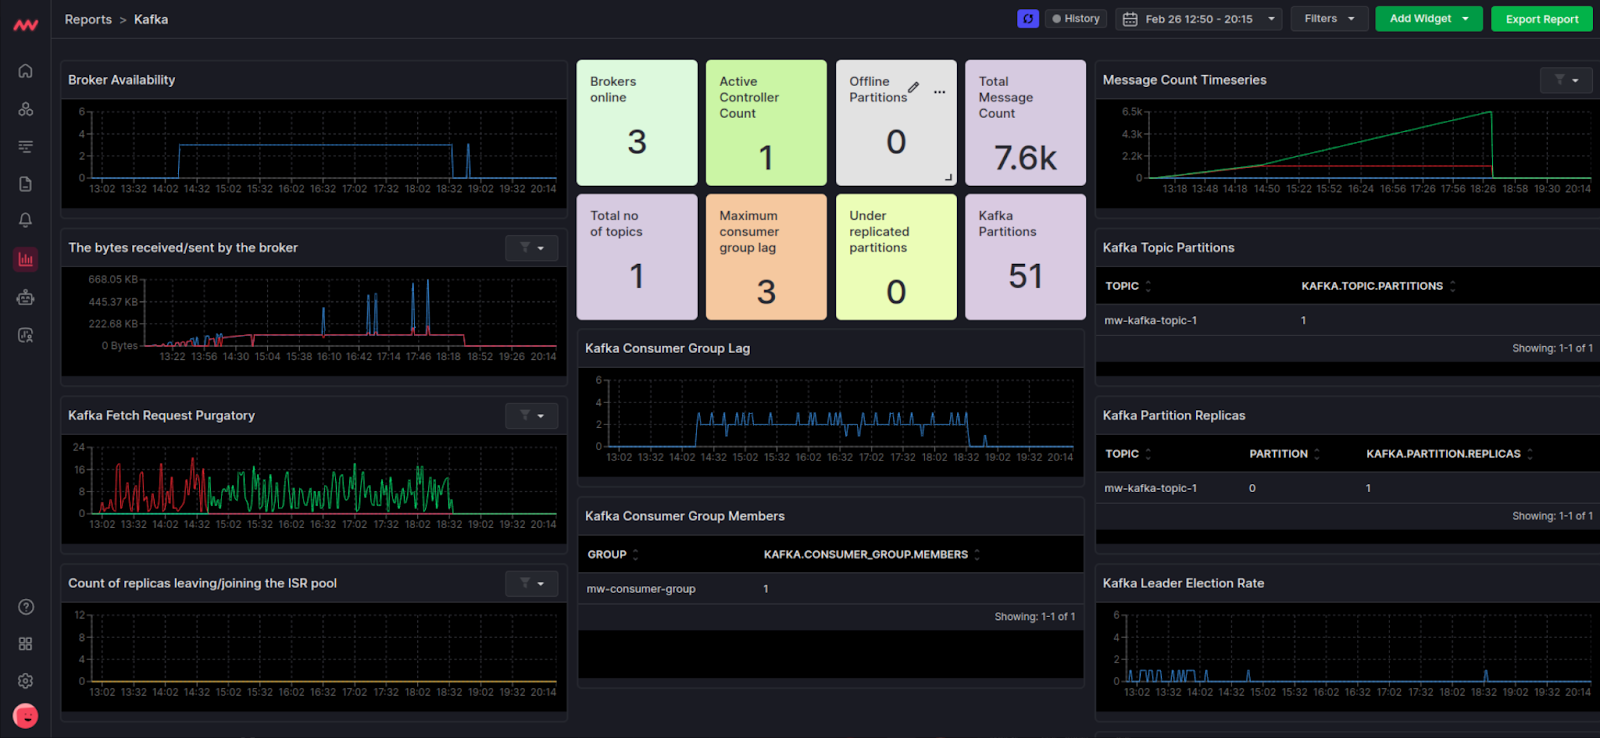
### Default Kafka Dashboard
Quickly access your Kafka data with Middleware’s default Kafka dashboard. Navigate to the Dashboard Builder and select the Kafka Dashboard:
# Metrics Collected
Create your own widget from scratch. Navigate to the Dashboard Builder and select the dashboard you would like to create a widget in. Select Add New Widget and choose the Kafka data source.
| **Metric** | **Description** | **Receiver** |
| ---------------------------------- | ---------------------------------------------------------------------------- | ------------ |
| `kafka.brokers` | Number of brokers in a given cluster | kafkametrics |
| `kafka.consumer_group.lag` | Current approximate lag of consumer group at partition of topic | kafkametrics |
| `kafka.consumer_group.lag_sum` | Current approximate sum of consumer group lag across all partitions of topic | kafkametrics |
| `kafka.consumer_group.members` | Count of members in the consumer group | kafkametrics |
| `kafka.consumer_group.offset` | Current offset of the consumer group at partition of topic | kafkametrics |
| `kafka.consumer_group.offset_sum` | Sum of consumer group offset across partitions of topic | kafkametrics |
| `kafka.partition.current_offset` | Current offset of partition of topic | kafkametrics |
| `kafka.partition.oldest_offset` | Oldest offset of partition of topic | kafkametrics |
| `kafka.partition.replicas` | Number of replicas for partition of topic | kafkametrics |
| `kafka.partition.replicas_in_sync` | Number of synchronized replicas of partition | kafkametrics |
| `kafka.topic.partitions` | Number of partitions in topic. | kafkametrics |
| `kafka.message.count` | The number of messages received by the broker | jmx |
| `kafka.request.count` | The number of requests received by the broker | jmx |
| `kafka.request.failed` | The number of requests to the broker resulting in a failure | jmx |
| `kafka.request.time.total` | The total time the broker has taken to service requests | jmx |
| `kafka.request.time.50p` | The 50th percentile time the broker has taken to service requests | jmx |
| `kafka.request.time.99p` | The 99th percentile time the broker has taken to service requests | jmx |
| `kafka.request.queue` | Size of the request queue | jmx |
| `kafka.network.io` | The bytes received or sent by the broker | jmx |
| `kafka.purgatory.size` | The number of requests waiting in purgatory | jmx |
| `kafka.partition.count` | The number of partitions on the broker | jmx |
| `kafka.partition.offline` | The number of partitions offline | jmx |
| `kafka.partition.under_replicated` | The number of under replicated partitions | jmx |
| `kafka.isr.operation.count` | The number of in-sync replica shrink and expand operations | jmx |
| `kafka.max.lag` | The max lag in messages between follower and leader replicas | jmx |
| `kafka.controller.active.count` | The number of controllers active on the broker | jmx |
| `kafka.leader.election.rate` | Leader election rate | jmx |
| `kafka.unclean.election.rate` | Unclean leader election rate | jmx |
# Host Configuration Details
The following describes all input fields required to start streaming Kafka data to Middleware:
| **Input Field** | Definition |
| ----------------- | -------------------------------------------------------------------------- |
| `JMX Server Host` | Host name of JMX service URL |
| `JMX Port` | Port where JMX service URL is built |
| `Service Name` | Name for differentiating between Kafka brokers |
| `Jar Path` | Path where `opentlemetry-jmx-metrics.jar` is located on your local |
| `Broker Host` | Host name of broker URL |
| `Broker Port` | Port where broker URL is built |
| `Username` | Optional unless using Kafka Broker with authentication type SASL plaintext |
| `Password` | Optional unless using Kafka Broker with authentication type SASL plaintext |
# Next Steps
* [How to Create Alerts](https://docs.middleware.io/workflow/alerting/setup-alert)
* [Dashboard Basics & Customization](https://docs.middleware.io/workflow/custom-dashboard/dashboard-builder-overview)
* [Custom Telemetry Ingestion](https://docs.middleware.io/open-telemetry/otel-getting-started)
* [Getting Started With Real User Monitoring (RUM)](https://docs.middleware.io/rum/rum-overview)
* [Data Ingestion APIs](https://docs.middleware.io/data-ingestion-apis/opentelemetry-metrics)
Need assistance or want to learn more about Middleware? Contact us at support\[at]middleware.io.