> ## Documentation Index
> Fetch the complete documentation index at: https://mw-docs.middleware.io/llms.txt
> Use this file to discover all available pages before exploring further.
# AWS CloudWatch
> AWS CloudWatch Integration - Setup & Installation Docs | Middleware
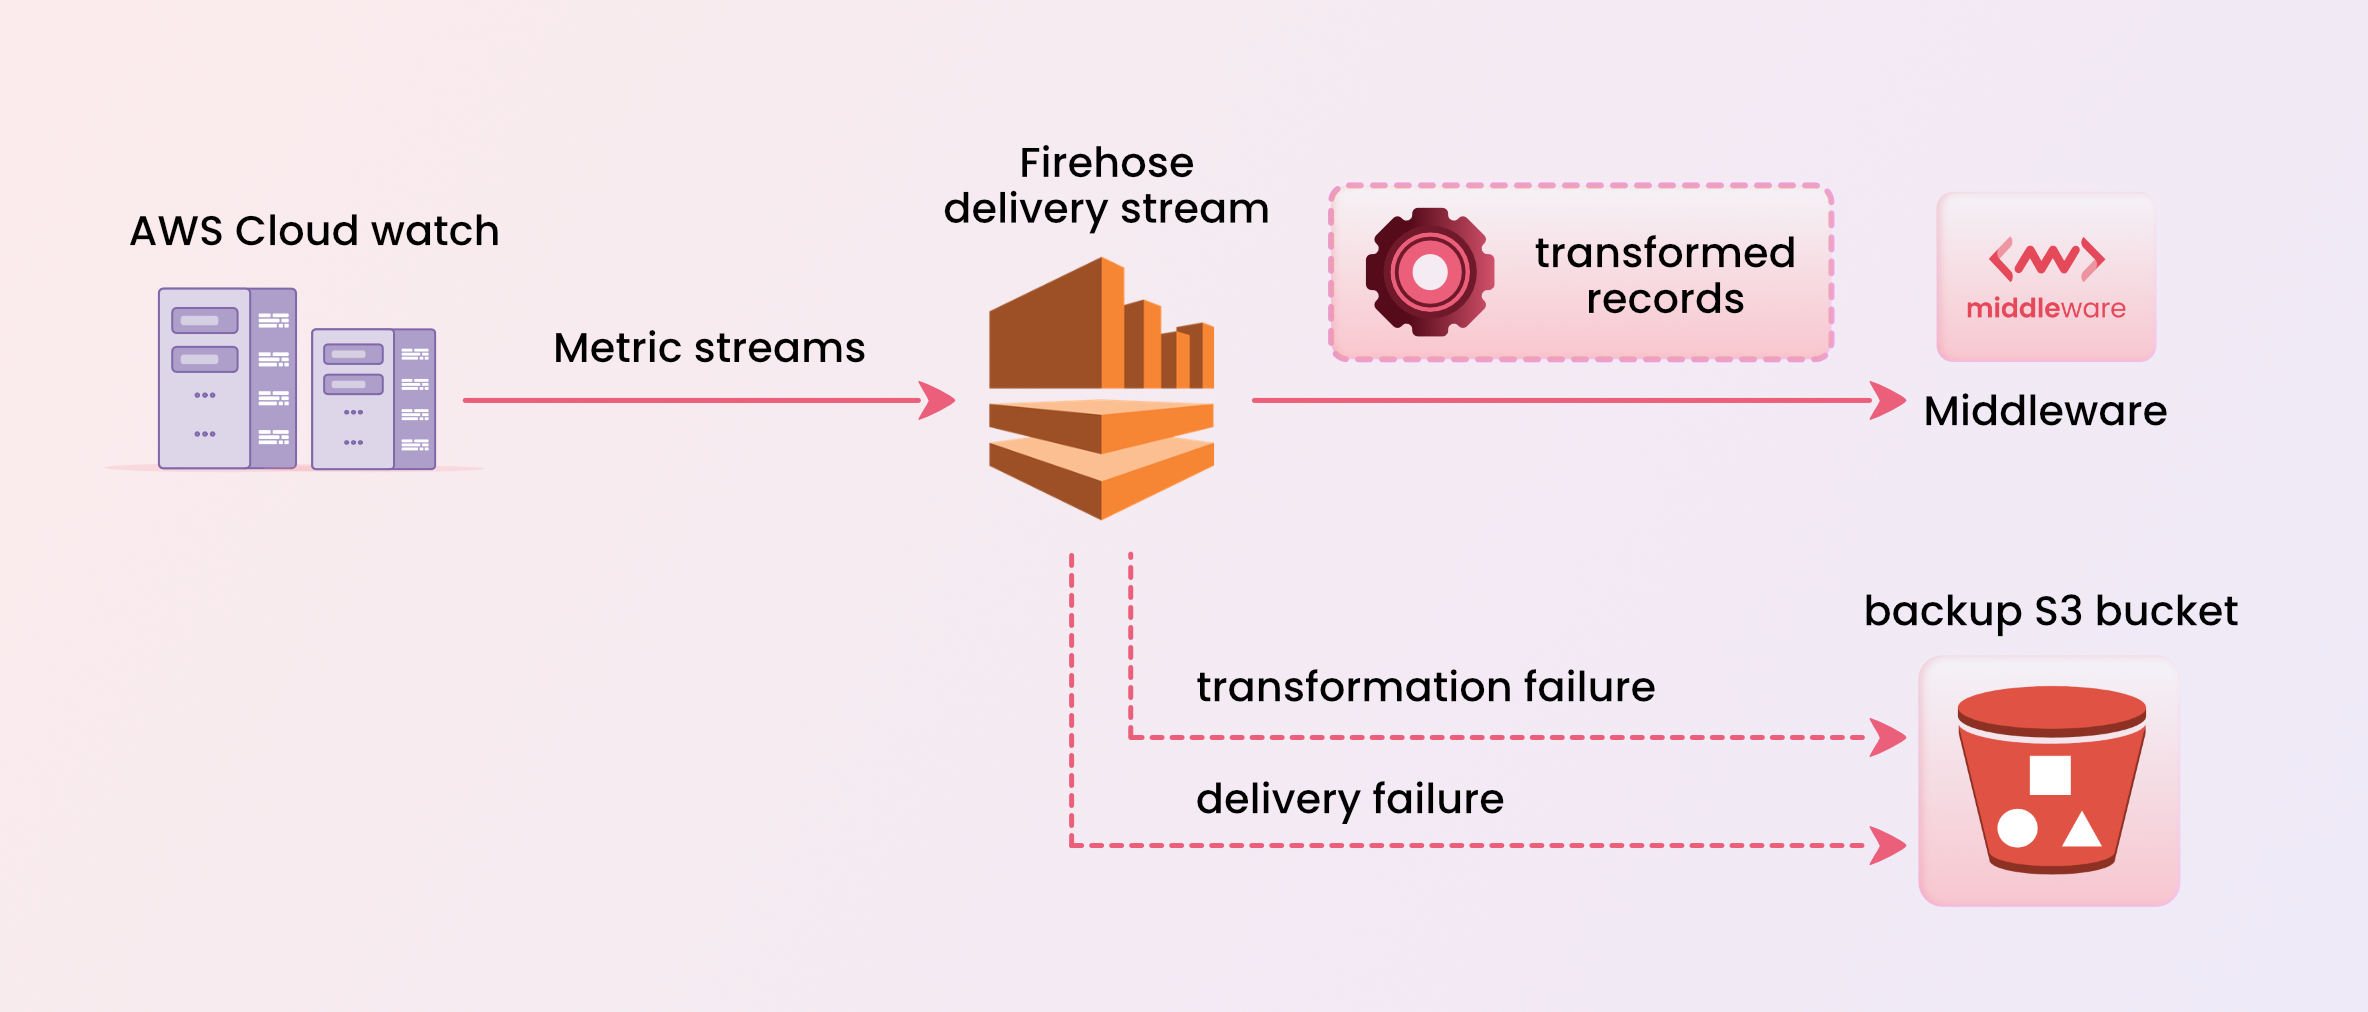 AWS [Metric Streams](https://docs.aws.amazon.com/AmazonCloudWatch/latest/monitoring/CloudWatch-Metric-Streams.html) is a service provided by Amazon Web Services (AWS) that enables real-time streaming of AWS CloudWatch metrics. Configure CloudWatch using the AWS Console.
# Setup
### Create Kinesis Data Firehose Delivery Stream
1. Sign in to the [AWS Management Console](https://console.aws.amazon.com/kinesis) and open the Kinesis console.
2. Choose **Data Firehose** in the navigation panel.
3. Choose **Create delivery stream**.
4. The stream’s Source should be **Direct PUT** and Destination set to **HTTP Endpoint** with the following details:\
**Kinesis endpoint:** https\://`{ACCOUNT-UID}`.middleware.io/v1/metrics/cloudwatch\
**Access key :** Enter your Middleware API key.
5. In the Backup settings, select an S3 backup bucket to receive any failed events that exceed the retry duration.
Replace `{ACCOUNT-UID}` with the text in the URL (ex URL is "s05zpimz.middleware.io", here s05zpimz is `{ACCOUNT-UID}`.)
### Create CloudWatch Metric Stream
1. Open the [CloudWatch AWS console](https://console.aws.amazon.com/cloudwatch).
2. In the left navigation pane, choose **Metrics → Streams**.
3. Click the **Create metric stream button**.
4. Choose the **All namespaces** in the metric stream.
5. Choose **Select an existing Firehose owned by your account**, and select the Firehose Delivery Stream you created earlier.
6. Specify an **Output Format of OpenTelemetry 1.0**.
7. Optionally, specify a name for this metric stream under **Metric Stream Name**.
8. Choose **Create metric stream**.
To ensure that your request metrics are accurately reported, it is important to [Enable Requests metrics](https://docs.aws.amazon.com/AmazonS3/latest/userguide/cloudwatch-monitoring.html) for your Amazon S3 buckets through the AWS console.
# Visualize Your Metrics
Once you have completed the setup mentioned above, you can visualize your data in the 2 difefrent ways.
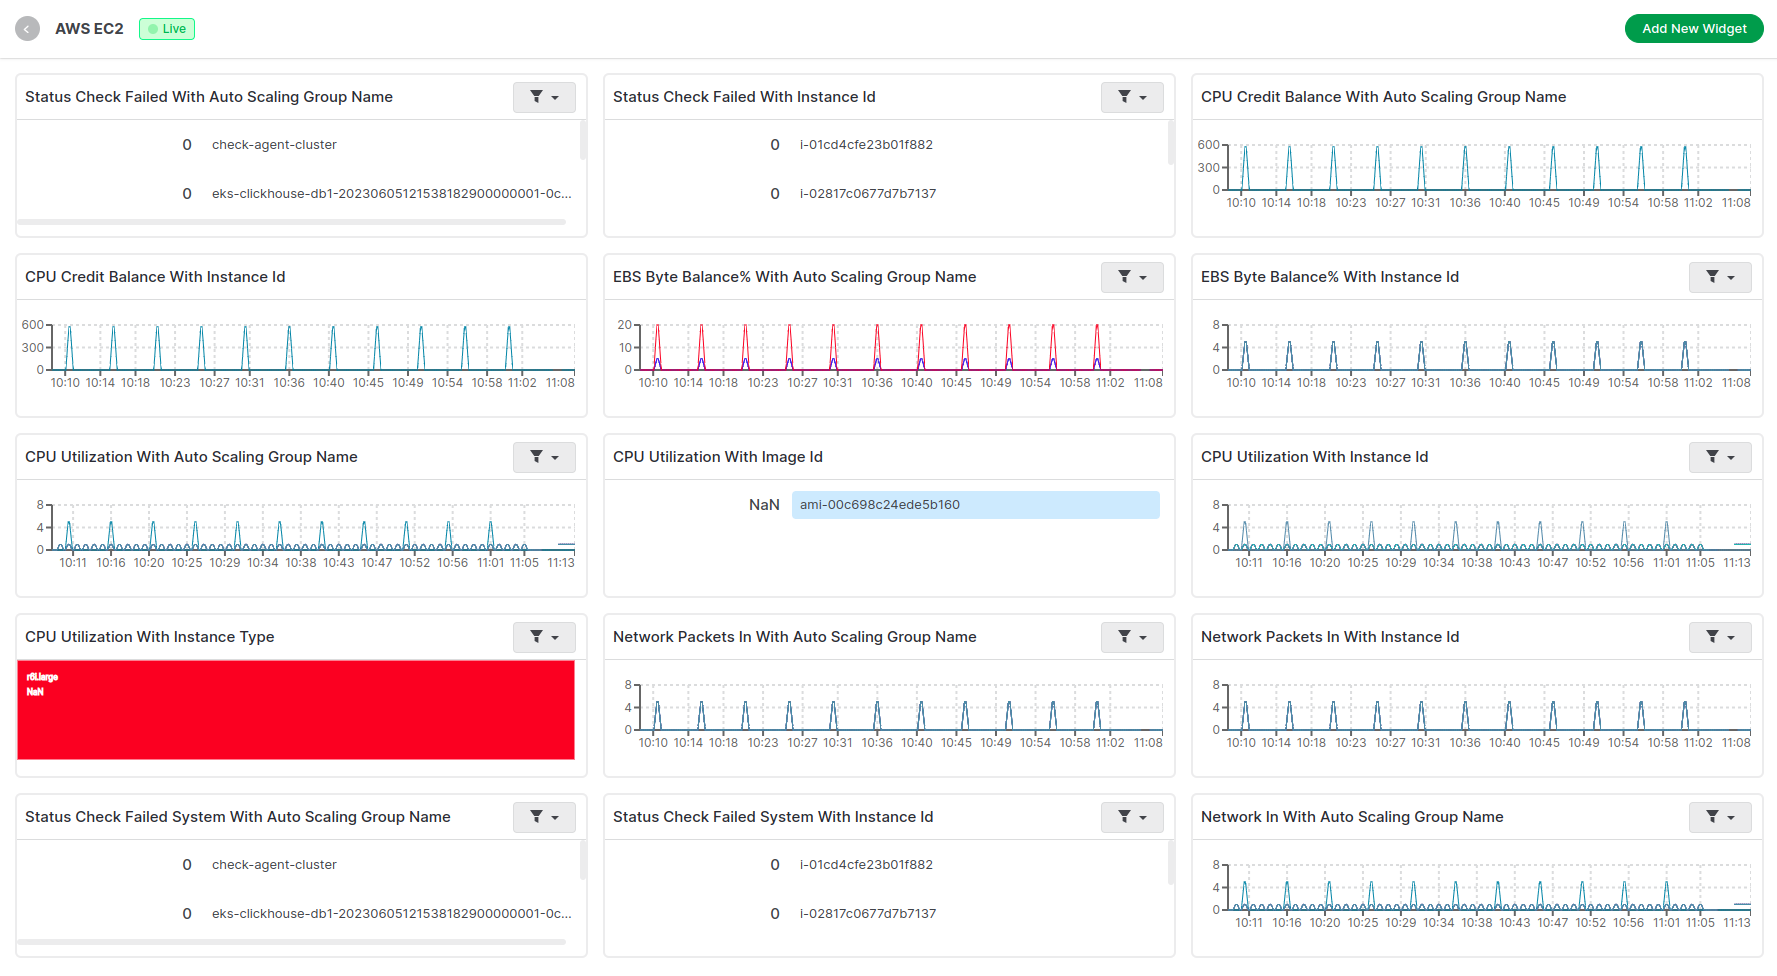
### 1. Middleware's Default AWS Dashboards
We have created default dashboards for all the popular AWS services.
Each dashboard consists a good amount of graphs representing all the important metrics for that particular namespace.
Here is one sample dashboard for EC2 namespace.
AWS [Metric Streams](https://docs.aws.amazon.com/AmazonCloudWatch/latest/monitoring/CloudWatch-Metric-Streams.html) is a service provided by Amazon Web Services (AWS) that enables real-time streaming of AWS CloudWatch metrics. Configure CloudWatch using the AWS Console.
# Setup
### Create Kinesis Data Firehose Delivery Stream
1. Sign in to the [AWS Management Console](https://console.aws.amazon.com/kinesis) and open the Kinesis console.
2. Choose **Data Firehose** in the navigation panel.
3. Choose **Create delivery stream**.
4. The stream’s Source should be **Direct PUT** and Destination set to **HTTP Endpoint** with the following details:\
**Kinesis endpoint:** https\://`{ACCOUNT-UID}`.middleware.io/v1/metrics/cloudwatch\
**Access key :** Enter your Middleware API key.
5. In the Backup settings, select an S3 backup bucket to receive any failed events that exceed the retry duration.
Replace `{ACCOUNT-UID}` with the text in the URL (ex URL is "s05zpimz.middleware.io", here s05zpimz is `{ACCOUNT-UID}`.)
### Create CloudWatch Metric Stream
1. Open the [CloudWatch AWS console](https://console.aws.amazon.com/cloudwatch).
2. In the left navigation pane, choose **Metrics → Streams**.
3. Click the **Create metric stream button**.
4. Choose the **All namespaces** in the metric stream.
5. Choose **Select an existing Firehose owned by your account**, and select the Firehose Delivery Stream you created earlier.
6. Specify an **Output Format of OpenTelemetry 1.0**.
7. Optionally, specify a name for this metric stream under **Metric Stream Name**.
8. Choose **Create metric stream**.
To ensure that your request metrics are accurately reported, it is important to [Enable Requests metrics](https://docs.aws.amazon.com/AmazonS3/latest/userguide/cloudwatch-monitoring.html) for your Amazon S3 buckets through the AWS console.
# Visualize Your Metrics
Once you have completed the setup mentioned above, you can visualize your data in the 2 difefrent ways.
### 1. Middleware's Default AWS Dashboards
We have created default dashboards for all the popular AWS services.
Each dashboard consists a good amount of graphs representing all the important metrics for that particular namespace.
Here is one sample dashboard for EC2 namespace.
 You can refer all similar dashboards relevant to AWS over [here](https://app.middleware.io/reports?search=AWS)
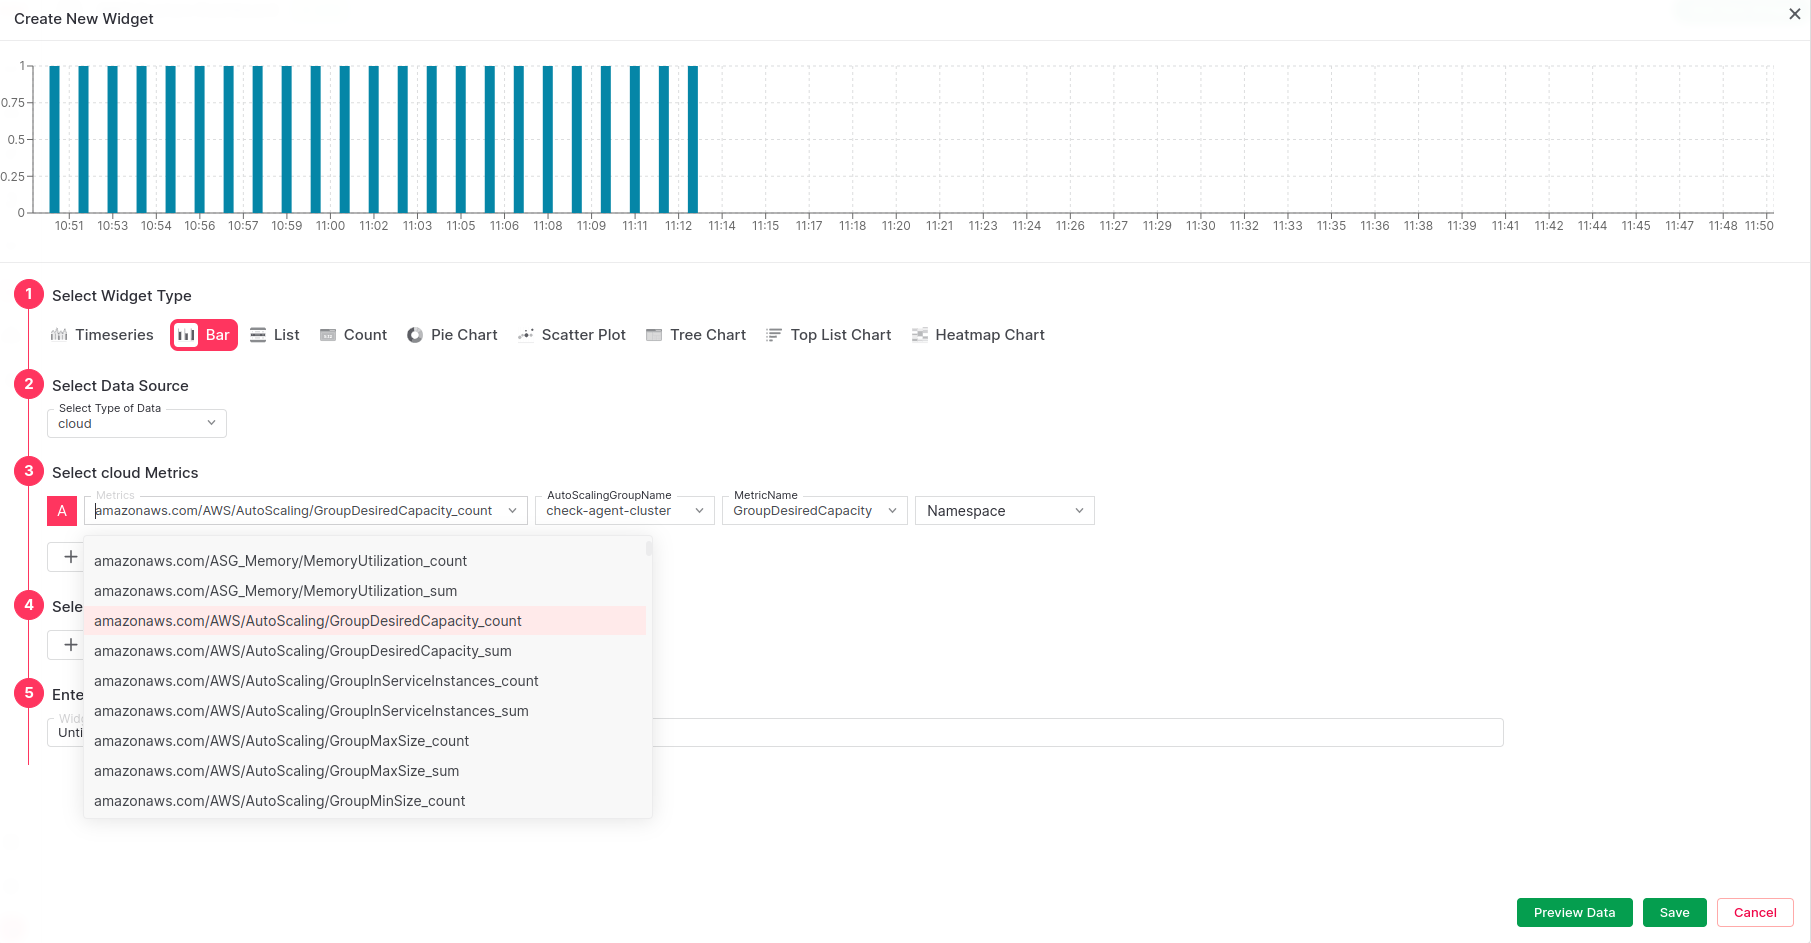
### 2. Build Custom Widgets using Middleware's Dashboard Builder
You can create a dashboard from scratch by yourself.
If you add a new widget to any existing dashboard, you will be able to see list of available AWS metrics under the "cloud" Data source.
You can visualize in many different Widget types i.e. Timeseries, Bar Chart, Pie Chart, etc.
You can refer all similar dashboards relevant to AWS over [here](https://app.middleware.io/reports?search=AWS)
### 2. Build Custom Widgets using Middleware's Dashboard Builder
You can create a dashboard from scratch by yourself.
If you add a new widget to any existing dashboard, you will be able to see list of available AWS metrics under the "cloud" Data source.
You can visualize in many different Widget types i.e. Timeseries, Bar Chart, Pie Chart, etc.
 # Troubleshooting
If you do not see the Integrations Menu in Middlware, that means your account has not been granted `Installation` permissions. Contact your system administrator to add the `Installation` permission to your user role in Settings.
# Next Steps
* [How to Create Alerts](https://docs.middleware.io/workflow/alerting/setup-alert)
* [Dashboard Basics & Customization](https://docs.middleware.io/workflow/custom-dashboard/dashboard-builder-overview)
* [Custom Telemetry Ingestion](https://docs.middleware.io/open-telemetry/otel-getting-started)
* [Getting Started With Real User Monitoring (RUM)](https://docs.middleware.io/rum/rum-overview)
* [Data Ingestion APIs](https://docs.middleware.io/data-ingestion-apis/opentelemetry-metrics)
Need assistance or want to learn more about Middleware? Contact us at support\[at]middleware.io.
# Troubleshooting
If you do not see the Integrations Menu in Middlware, that means your account has not been granted `Installation` permissions. Contact your system administrator to add the `Installation` permission to your user role in Settings.
# Next Steps
* [How to Create Alerts](https://docs.middleware.io/workflow/alerting/setup-alert)
* [Dashboard Basics & Customization](https://docs.middleware.io/workflow/custom-dashboard/dashboard-builder-overview)
* [Custom Telemetry Ingestion](https://docs.middleware.io/open-telemetry/otel-getting-started)
* [Getting Started With Real User Monitoring (RUM)](https://docs.middleware.io/rum/rum-overview)
* [Data Ingestion APIs](https://docs.middleware.io/data-ingestion-apis/opentelemetry-metrics)
Need assistance or want to learn more about Middleware? Contact us at support\[at]middleware.io.