> ## Documentation Index
> Fetch the complete documentation index at: https://mw-docs.middleware.io/llms.txt
> Use this file to discover all available pages before exploring further.
# PostgreSQL
> PostgreSQL Integration - Setup & Installation Docs | Middleware
The PostgreSQL Integration allows you to ingest and monitor the performance and health metrics of your object-relational database management system (ORDBMS) data. This integration is useful for tracking the total number of blocks read into memory, identifying disk space utilization per table, tallying insert operations, and rollbacks triggered.
# Prerequisites
Middleware Host Agent (MW Agent) must be installed on your local machine. To install the MW Agent, see our [Installation Guide](https://docs.middleware.io/agent-installation/overview).
# Setup
### Step 1: Create Database Credentials
Create a `.yaml` file containing database credentials like the below example:
`/home/ubuntu/postgres_creds.yaml`
```yaml .yaml theme={null}
postgresql:
endpoint: localhost:5423
username: postgres
password: postgres
```
### Step 2: Access Integrations
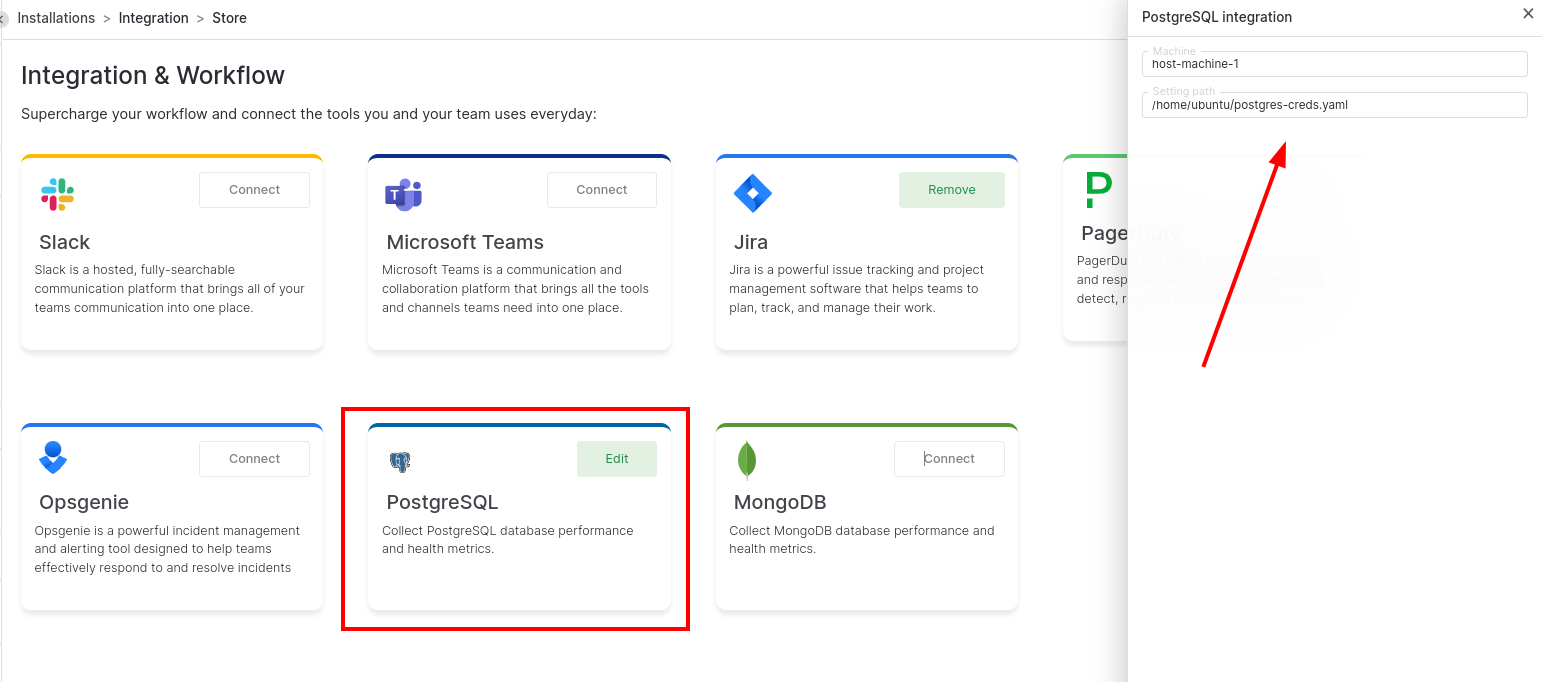
Log in to Middleware, navigate to the Installations Page in the bottom left corner, select All Integration and click PostgreSQL
 ### Step 3: Enable Integration
Add a host machine from the dropdown list, input the credential path from Step 1, and Save
# Visualize Your Data
### Default PostgreSQL Dashboard
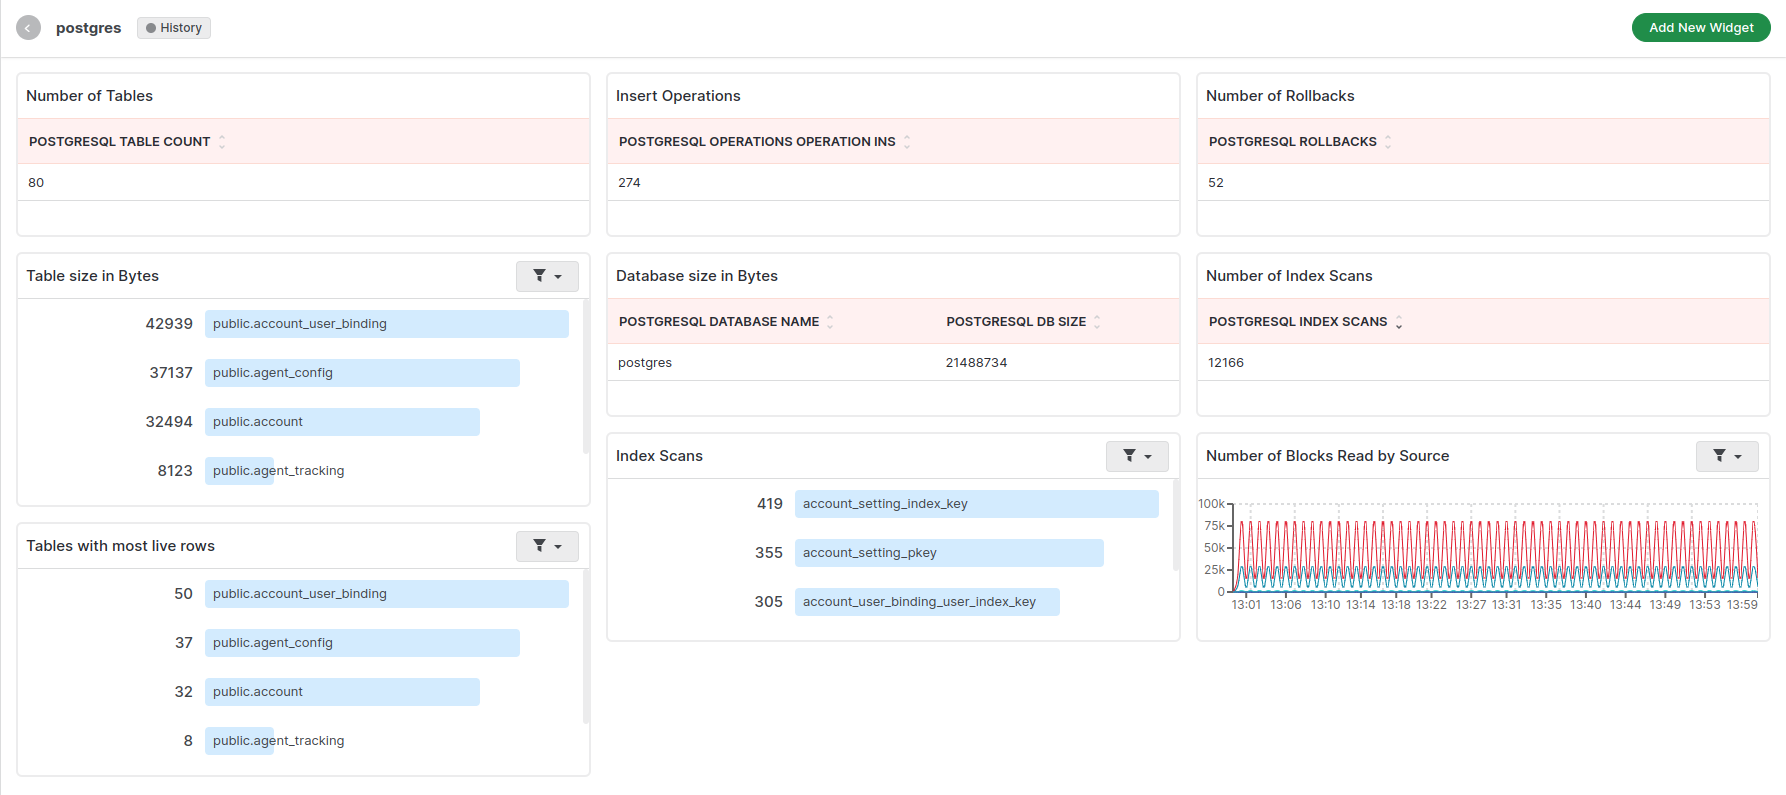
Once the PostgreSQL integration setup is complete, a new PostgreSQL-specific dashboard will appear in the Dashboard Builder. This default dashboard serves as a jumping off point for visualizing and analyzing PostgreSQL data.
### Step 3: Enable Integration
Add a host machine from the dropdown list, input the credential path from Step 1, and Save
# Visualize Your Data
### Default PostgreSQL Dashboard
Once the PostgreSQL integration setup is complete, a new PostgreSQL-specific dashboard will appear in the Dashboard Builder. This default dashboard serves as a jumping off point for visualizing and analyzing PostgreSQL data.
 ### Create PostgreSQL Widget
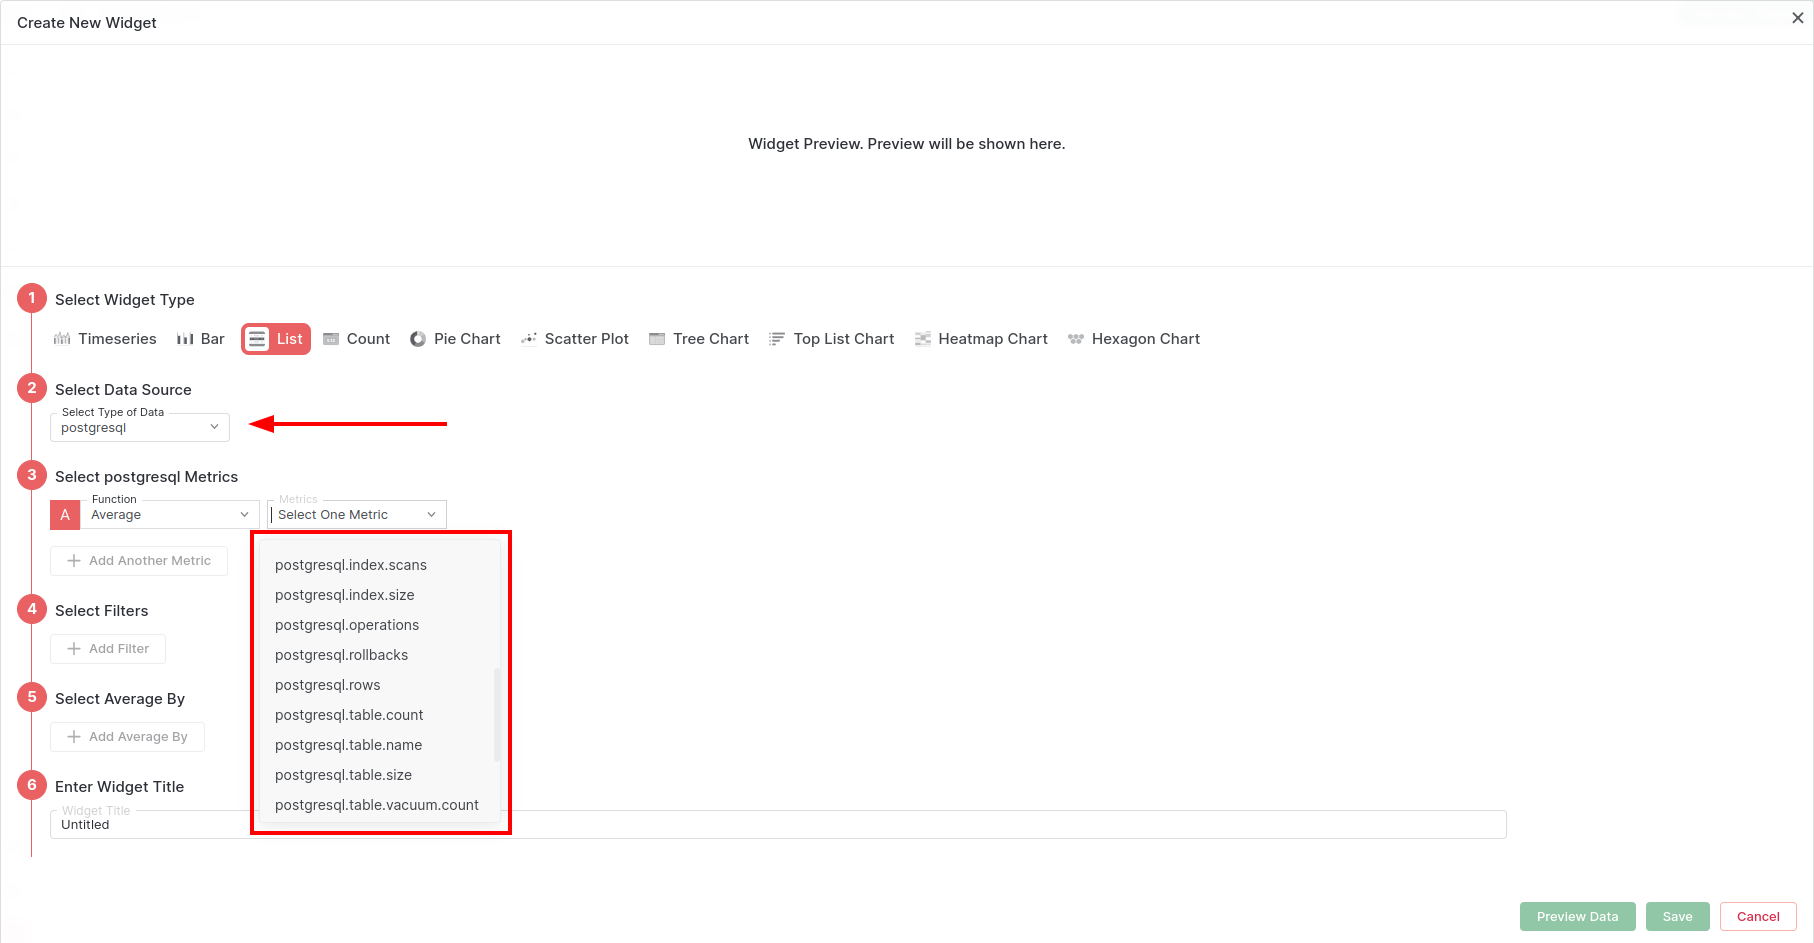
PostgreSQL data can be added to dashboards as a custom widget. When adding a new widget, select the `postgresql` data source to view a full list of available PostgreSQL data.
### Create PostgreSQL Widget
PostgreSQL data can be added to dashboards as a custom widget. When adding a new widget, select the `postgresql` data source to view a full list of available PostgreSQL data.
 # Alerts
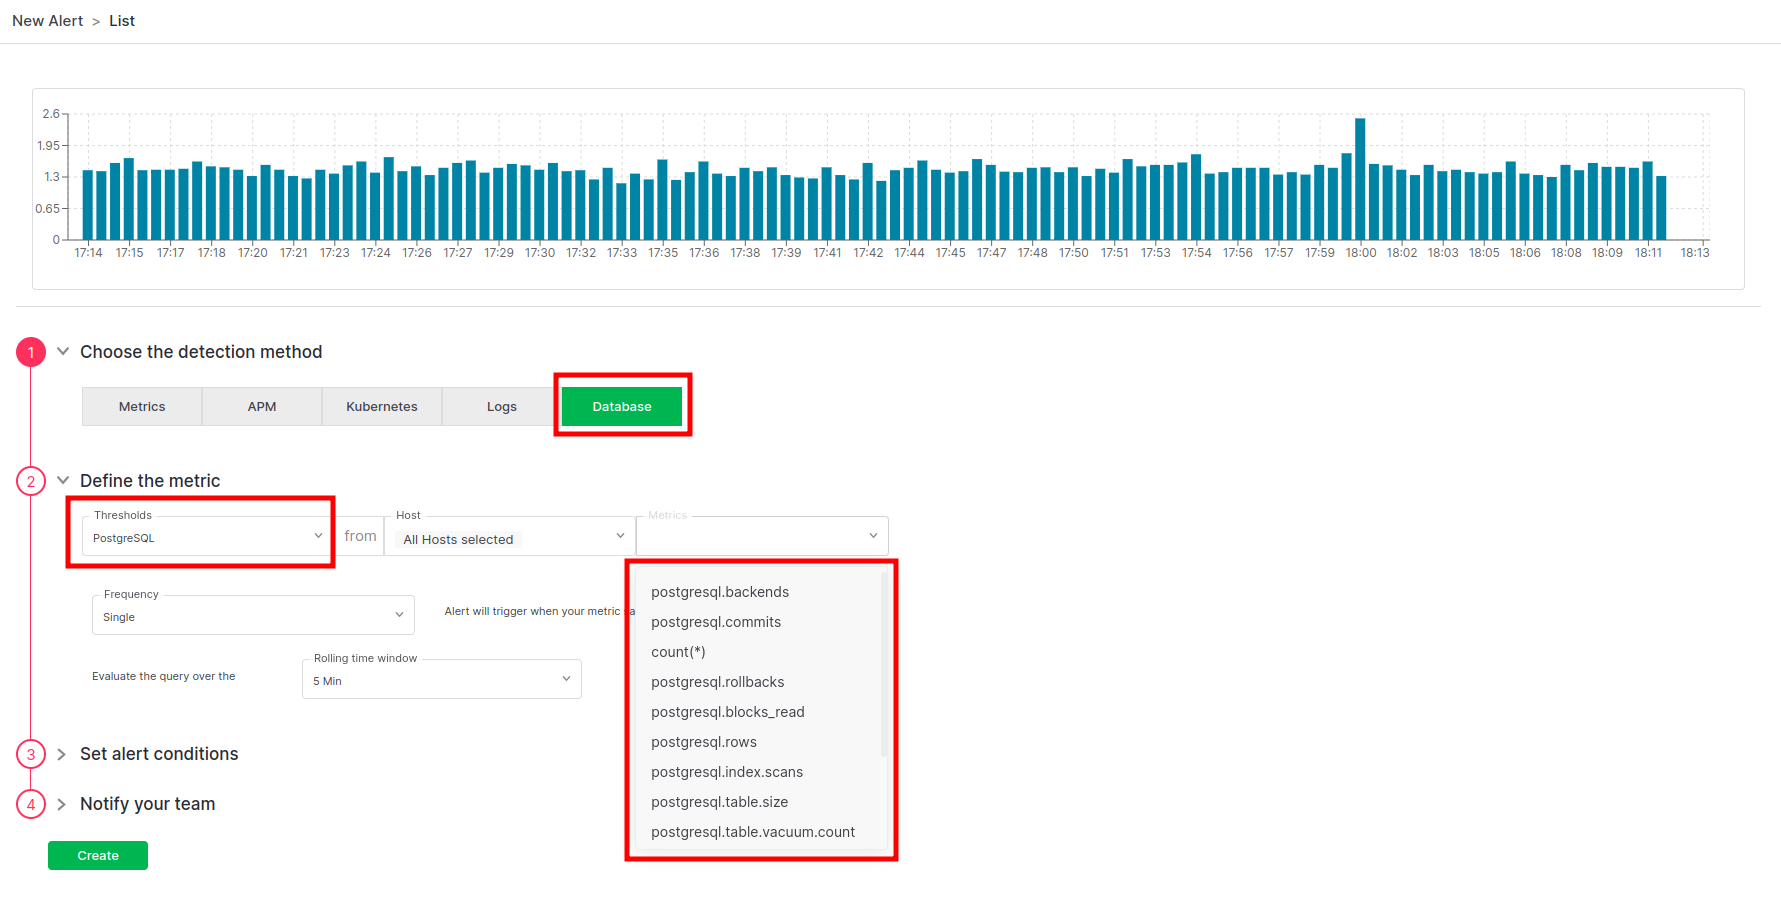
Alerts can be configured for any PostgreSQL metrics. When creating a new rule select the Database detection method and PostgreSQL database type for available metrics to appear in the Metrics dropdown list. Select the desired metric and continue configuring the alert conditions.
# Alerts
Alerts can be configured for any PostgreSQL metrics. When creating a new rule select the Database detection method and PostgreSQL database type for available metrics to appear in the Metrics dropdown list. Select the desired metric and continue configuring the alert conditions.
 # Metrics Collected
| **Metric** | **Description** |
| --------------------------------------- | ----------------------------------------------------------------------------------------------------- |
| `postgresql.backends` | Number of backends |
| `postgresql.bgwriter.buffers.allocated` | Number of buffers allocated |
| `postgresql.bgwriter.buffers.writes` | Number of buffers written |
| `postgresql.bgwriter.checkpoint.count` | Number of checkpoints performed |
| `postgresql.bgwriter.duration` | Total time spent in checkpoint processing writing and syncing files to disk, in milliseconds |
| `postgresql.bgwriter.maxwritten` | Number of times the background writer stopped a cleaning scan because it had written too many buffers |
| `postgresql.blocks_read` | Number of disk blocks read |
| `postgresql.commits` | Number of transactions that have been committed |
| `postgresql.connection.max` | Configured maximum number of client connections allowed |
| `postgresql.database.count` | Count of databases in a cluster |
| `postgresql.db_size` | Database disk size |
| `postgresql.index.scans` | Number of index scans on a table |
| `postgresql.index.size` | Size of the index on disk |
| `postgresql.operations` | Number of db row operations |
| `postgresql.rollbacks` | Number of rollbacks |
| `postgresql.rows` | Number of rows in the database |
| `postgresql.table.count` | Number of user tables in a database |
| `postgresql.table.size` | Disk space used by a table |
| `postgresql.table.vacuum.count` | Number of times a table has been manually vacuumed |
# Troubleshooting
If you do not see the Integrations Menu in Middlware, that means your account has not been granted `Installation` permissions. Contact your system administrator to add the `Installation` permission to your user role in Settings.
# Next Steps
* [How to Create Alerts](https://docs.middleware.io/workflow/alerting/setup-alert)
* [Dashboard Basics & Customization](https://docs.middleware.io/workflow/custom-dashboard/dashboard-builder-overview)
* [Custom Telemetry Ingestion](https://docs.middleware.io/open-telemetry/otel-getting-started)
* [Getting Started With Real User Monitoring (RUM)](https://docs.middleware.io/rum/rum-overview)
* [Data Ingestion APIs](https://docs.middleware.io/data-ingestion-apis/opentelemetry-metrics)
Need assistance or want to learn more about Middleware? Contact us at support\[at]middleware.io.
# Metrics Collected
| **Metric** | **Description** |
| --------------------------------------- | ----------------------------------------------------------------------------------------------------- |
| `postgresql.backends` | Number of backends |
| `postgresql.bgwriter.buffers.allocated` | Number of buffers allocated |
| `postgresql.bgwriter.buffers.writes` | Number of buffers written |
| `postgresql.bgwriter.checkpoint.count` | Number of checkpoints performed |
| `postgresql.bgwriter.duration` | Total time spent in checkpoint processing writing and syncing files to disk, in milliseconds |
| `postgresql.bgwriter.maxwritten` | Number of times the background writer stopped a cleaning scan because it had written too many buffers |
| `postgresql.blocks_read` | Number of disk blocks read |
| `postgresql.commits` | Number of transactions that have been committed |
| `postgresql.connection.max` | Configured maximum number of client connections allowed |
| `postgresql.database.count` | Count of databases in a cluster |
| `postgresql.db_size` | Database disk size |
| `postgresql.index.scans` | Number of index scans on a table |
| `postgresql.index.size` | Size of the index on disk |
| `postgresql.operations` | Number of db row operations |
| `postgresql.rollbacks` | Number of rollbacks |
| `postgresql.rows` | Number of rows in the database |
| `postgresql.table.count` | Number of user tables in a database |
| `postgresql.table.size` | Disk space used by a table |
| `postgresql.table.vacuum.count` | Number of times a table has been manually vacuumed |
# Troubleshooting
If you do not see the Integrations Menu in Middlware, that means your account has not been granted `Installation` permissions. Contact your system administrator to add the `Installation` permission to your user role in Settings.
# Next Steps
* [How to Create Alerts](https://docs.middleware.io/workflow/alerting/setup-alert)
* [Dashboard Basics & Customization](https://docs.middleware.io/workflow/custom-dashboard/dashboard-builder-overview)
* [Custom Telemetry Ingestion](https://docs.middleware.io/open-telemetry/otel-getting-started)
* [Getting Started With Real User Monitoring (RUM)](https://docs.middleware.io/rum/rum-overview)
* [Data Ingestion APIs](https://docs.middleware.io/data-ingestion-apis/opentelemetry-metrics)
Need assistance or want to learn more about Middleware? Contact us at support\[at]middleware.io.