> ## Documentation Index
> Fetch the complete documentation index at: https://mw-docs.middleware.io/llms.txt
> Use this file to discover all available pages before exploring further.
# Prometheus
> Prometheus Integration - Setup & Installation Docs | Middleware
Retrieve metrics from a Prometheus endpoint.
# Prerequisites
Middleware Host Agent (MW Agent) must be installed on your local machine. To install the MW Agent, see our [Installation Guide](https://docs.middleware.io/agent-installation/overview).
# Setup
Follow these steps to set up the Prometheus integration:
1. In the Middleware UI, navigate to the [**Integrations**](https://app.middleware.io/installation#integration/allintegration) page
2. Click on the Prometheus integration and you will see some settings as shown below:
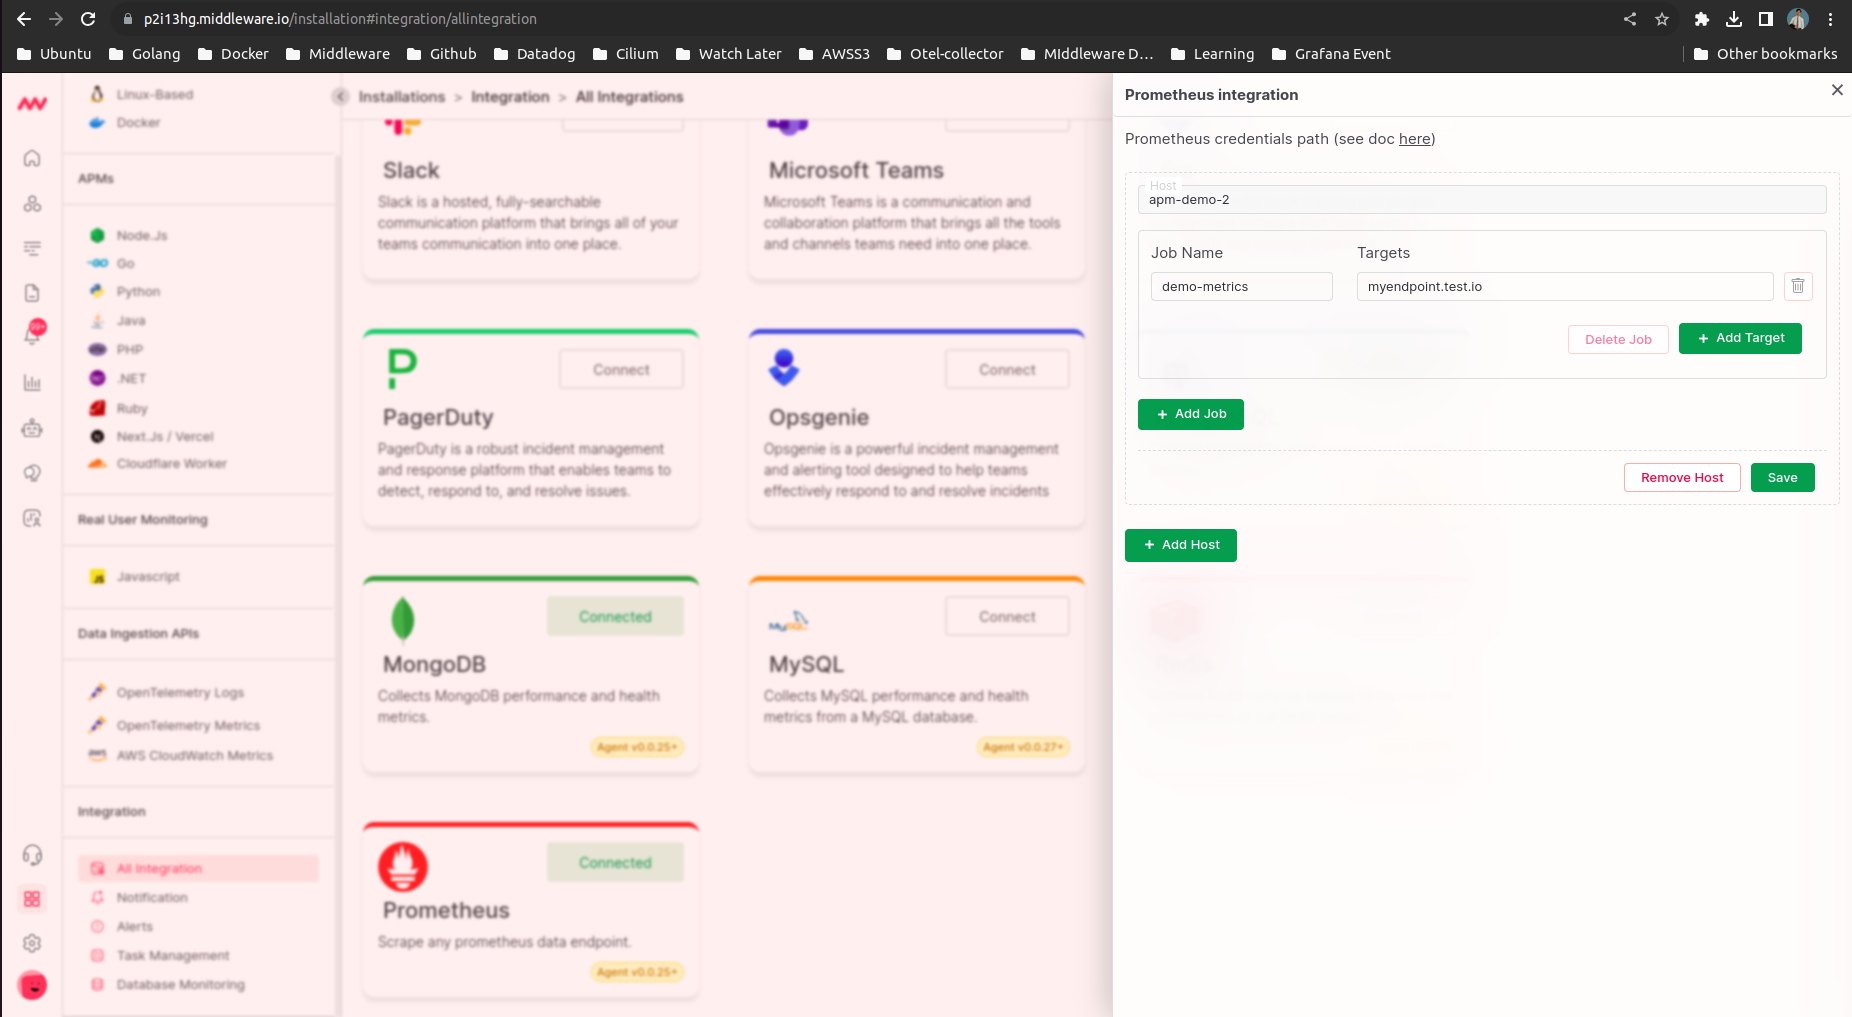 a) First you will need to select the host from which you can access your prometheus endpoint.
b) Add Prometheus Endpoint Name and URL, which we call Job and Target in Prometheus. (You can also add multiple URLs under 1 name)
Once you save these settings. Middleware agent will start collecting metrics from the Prometheus endpoint.
# Create your own dashboard
a) First you will need to select the host from which you can access your prometheus endpoint.
b) Add Prometheus Endpoint Name and URL, which we call Job and Target in Prometheus. (You can also add multiple URLs under 1 name)
Once you save these settings. Middleware agent will start collecting metrics from the Prometheus endpoint.
# Create your own dashboard
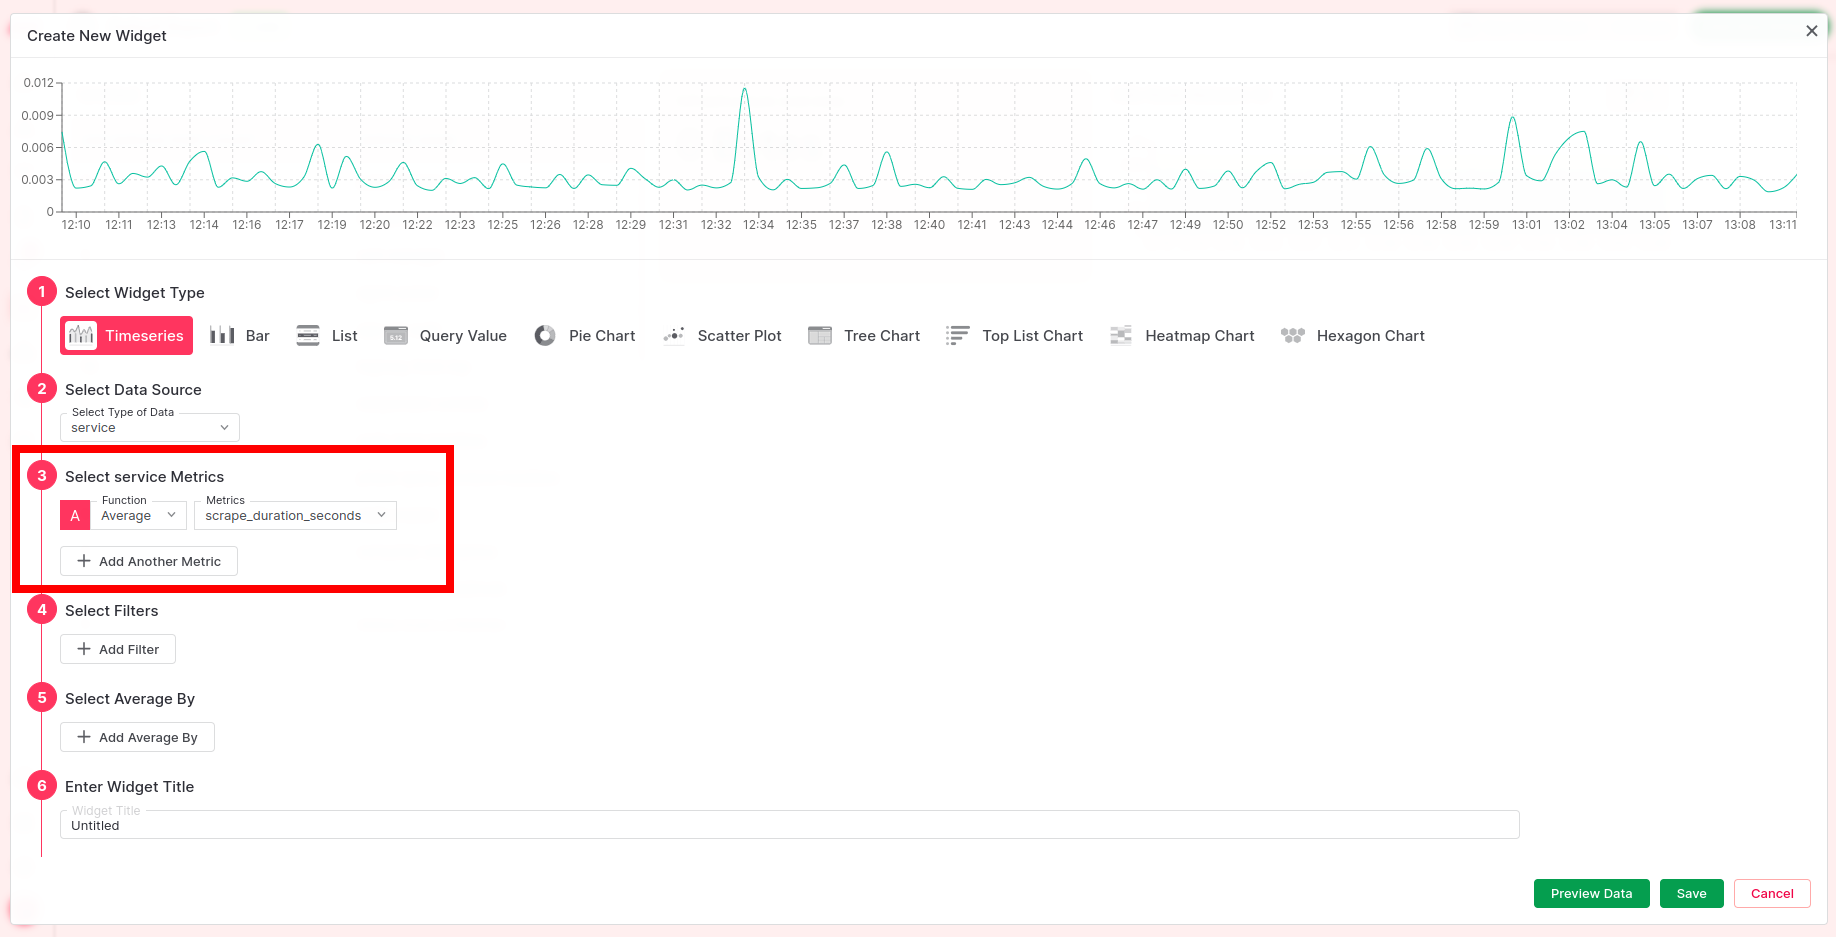
You can create your custom dashboard based on prometheus endpoint we just scraped.
When adding a new widget to an existing dashboard, you will find a list of available Prometheus metrics under the "service" data source.
These metrics can be visualized using various widget types, such as Timeseries, Bar Chart, Pie Chart, and more.
Data source "service" contains all the miscellaneous sources. Soon, we will be promoting "prometheus" as a data source.
 # Troubleshooting
If you do not see the Integrations Menu in Middlware, that means your account has not been granted `Installation` permissions. Contact your system administrator to add the `Installation` permission to your user role in Settings.
# Next Steps
* [How to Create Alerts](https://docs.middleware.io/workflow/alerting/setup-alert)
* [Dashboard Basics & Customization](https://docs.middleware.io/workflow/custom-dashboard/dashboard-builder-overview)
* [Custom Telemetry Ingestion](https://docs.middleware.io/open-telemetry/otel-getting-started)
* [Getting Started With Real User Monitoring (RUM)](https://docs.middleware.io/rum/rum-overview)
* [Data Ingestion APIs](https://docs.middleware.io/data-ingestion-apis/opentelemetry-metrics)
* [Configure OTel Collector Contrib](https://docs.middleware.io/open-telemetry/otel-collector)
Need assistance or want to learn more about Middleware? Contact us at support\[at]middleware.io.
# Troubleshooting
If you do not see the Integrations Menu in Middlware, that means your account has not been granted `Installation` permissions. Contact your system administrator to add the `Installation` permission to your user role in Settings.
# Next Steps
* [How to Create Alerts](https://docs.middleware.io/workflow/alerting/setup-alert)
* [Dashboard Basics & Customization](https://docs.middleware.io/workflow/custom-dashboard/dashboard-builder-overview)
* [Custom Telemetry Ingestion](https://docs.middleware.io/open-telemetry/otel-getting-started)
* [Getting Started With Real User Monitoring (RUM)](https://docs.middleware.io/rum/rum-overview)
* [Data Ingestion APIs](https://docs.middleware.io/data-ingestion-apis/opentelemetry-metrics)
* [Configure OTel Collector Contrib](https://docs.middleware.io/open-telemetry/otel-collector)
Need assistance or want to learn more about Middleware? Contact us at support\[at]middleware.io.