Skip to main contentReal User monitoring with Middleware
After you complete the setup of your RUM application with Middleware you can see all your applications in the RUM Dashboard.
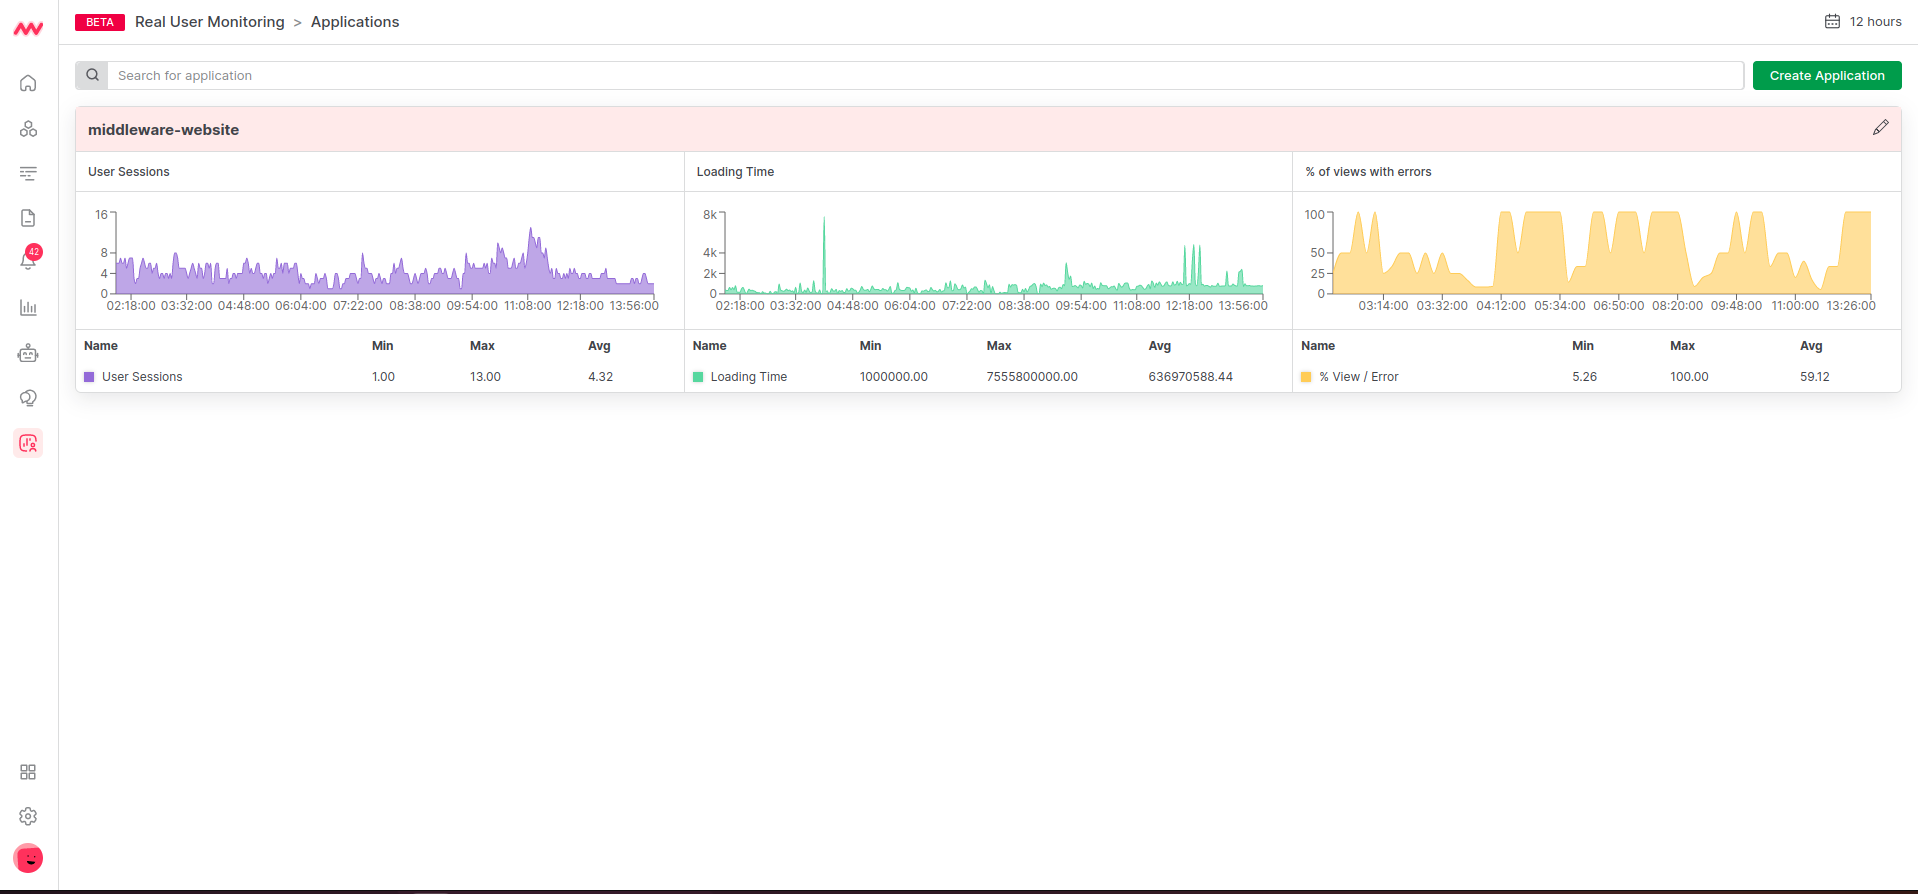 On the dashboard you can see three major metrics with respective graphs.
- User sessions refer to the interactions of a single user with a website or application within a specific time frame. A session starts when a user accesses the website or app and ends when there is a period of inactivity or after a defined timeout. User sessions are crucial for understanding user behavior, engagement, and overall experience on the platform. you can track user sessions to learn about active users, session length, and popular paths. This helps you understand user engagement and improve their journey for better satisfaction and desired actions. Monitoring the session duration and bounce rate allows you to identify potential areas of improvement to reduce bounce rates and increase session duration.
- Loading Time is a critical metric measured by RUM that reflects how quickly a web page or application loads for end-users. It directly impacts user experience, as users expect fast and responsive websites. Slow loading times can lead to higher bounce rates, lower user satisfaction, and a negative impact on search engine rankings.
- % of Views with Errors is the metric to measures the percentage of user sessions that encounter errors while using the website or application. Errors can include JavaScript exceptions, server-side errors, broken resources, and other issues that prevent the page from functioning correctly. Monitoring the % of views with errors helps identify areas that require immediate attention and can have a significant impact on user satisfaction and retention.
Now to see more details about the particular application you can click on the application and it will redirect you to the performance summary of the application.
Core Web Vitals P75
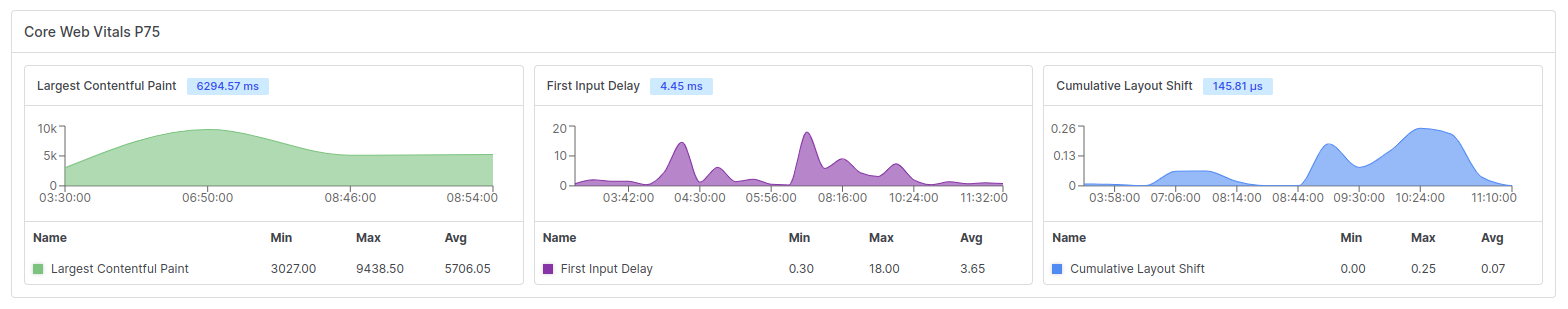 The Core Web Vitals P75 section provides a comprehensive overview of the Core Web Vitals performance metrics for the 75th percentile of user sessions. Core Web Vitals are essential factors in measuring the user experience on your website, and the P75 percentile represents the performance experienced by the majority of your users. This section includes three graphs and overall values for Largest Contentful Paint (LCP), First Input Delay (FID), and Cumulative Layout Shift (CLS).
-
Largest Contentful Paint (LCP) Graph:
The LCP graph displays the distribution of LCP timings for the 75th percentile of user sessions. LCP measures the time taken for the largest content element on the page to become visible to the user. It is a crucial metric to understand how quickly your website’s main content loads, which directly impacts the perceived page load speed by users.
-
First Input Delay (FID) Graph:
The FID graph illustrates the distribution of FID timings for the 75th percentile of user sessions. FID measures the time delay between a user’s first interaction (e.g., clicking a button) and the browser’s response to that interaction. A low FID is crucial for providing a responsive and interactive user experience.
-
Cumulative Layout Shift (CLS) Graph:
The CLS graph shows the distribution of CLS scores for the 75th percentile of user sessions. CLS measures the visual stability of the page and quantifies how much content shifts unexpectedly during the user’s interactions. A low CLS ensures that elements on the page do not move unexpectedly, preventing user frustration.
Errors
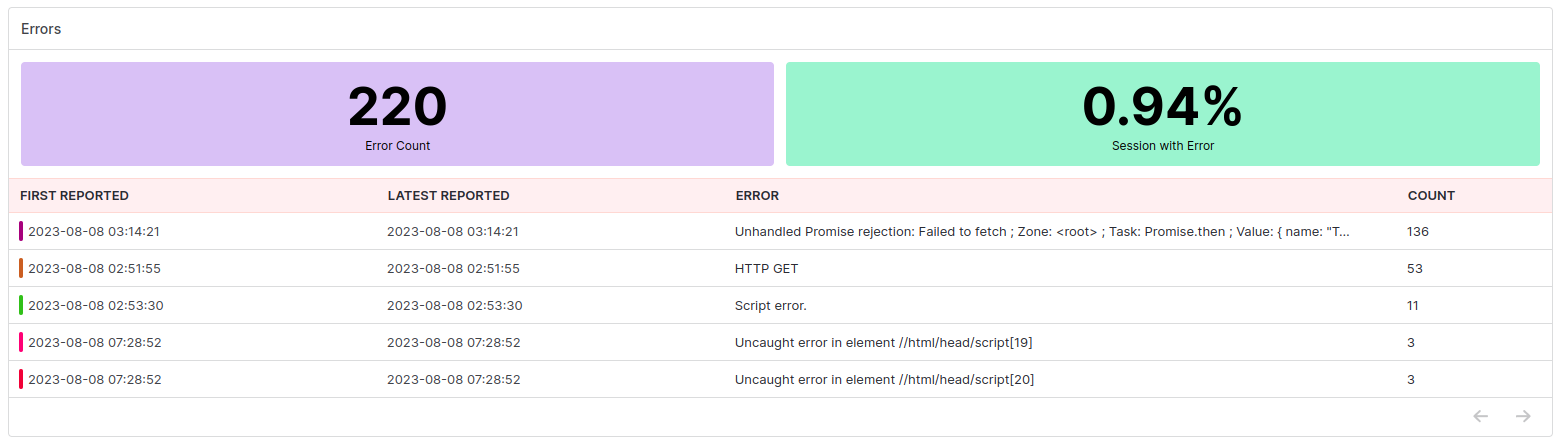 The Errors section provides insights into the errors encountered by users during their sessions. Identifying and addressing errors promptly is crucial for ensuring a smooth user experience and preventing potential issues that may negatively impact user engagement and conversion rates.
-
Total Errors: Total errors represent the cumulative count of errors recorded across all user sessions within the selected time frame. These errors can include JavaScript exceptions, server-side errors, broken resources, and other issues affecting the proper functioning of the website or application.
-
% of Sessions with Respect to Error: % of Sessions with Respect to Error is a percentage that reflects the number of sessions where errors occurred compared to the total number of sessions. It provides a clear picture of how widespread errors are among users and helps prioritize error resolution efforts.
-
Grouped Error List: The Grouped Error List categorizes the types of errors encountered during user sessions. It presents a breakdown of the most common error types and their respective frequencies. By identifying common error patterns, developers can focus on resolving critical issues that impact a significant portion of users.
User Analysis
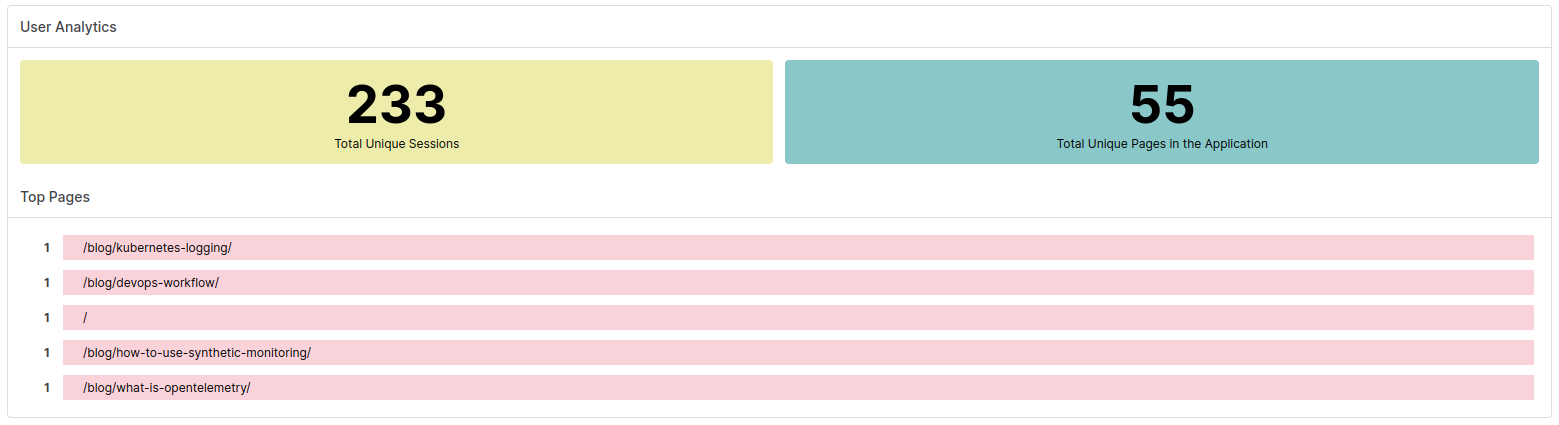 The User Analysis section offers insights into user engagement and behavior on your website or application. Understanding user activity and preferences helps optimize content and user journeys, leading to improved user satisfaction and overall platform performance.
-
Number of Top Unique Sessions: The Number of Top Unique Sessions represents the count of distinct user sessions with the highest engagement levels. Unique sessions are essential for understanding how many individual users are actively interacting with your platform.
-
Number of Unique Pages Visited: The Number of Unique Pages Visited displays the count of distinct pages accessed by users during their sessions. This metric helps identify popular pages and provides insights into user navigation patterns.
-
List of Top Visited Pages: The List of Top Visited Pages provides a ranked list of the most frequently accessed pages by users. This data highlights the pages that attract the most traffic and user attention, guiding content optimization and user experience improvements.
The Detailed View page of Real User Monitoring offers an in-depth analysis of user experience, performance metrics, error occurrences, and user behavior. By leveraging the provided insights, organizations can make informed decisions to enhance website performance, optimize user engagement, and deliver a seamless user experience. Regularly monitoring and acting upon the data from this page can lead to increased user satisfaction, reduced bounce rates, and improved overall platform success.
Session Listing
 In this tab you will get all the session list with their aggregated details.
- User Status: You can check if the user is still on your site or not (Live / Offline).
- Recording Availability: Quickly determine whether a session has a recording available.
- Visitor Info: You can identify visitor by their location and device.
- Total View Counts: Understand how many pages user has visited in the session.
- Recorded Errors: Identify the number of errors recorded within each session.
- Action Count: Gain precise insights into user activity during the session.
Exploring Sessions
Click on any specific session to delve into its extensive details. Here’s what you’ll find:
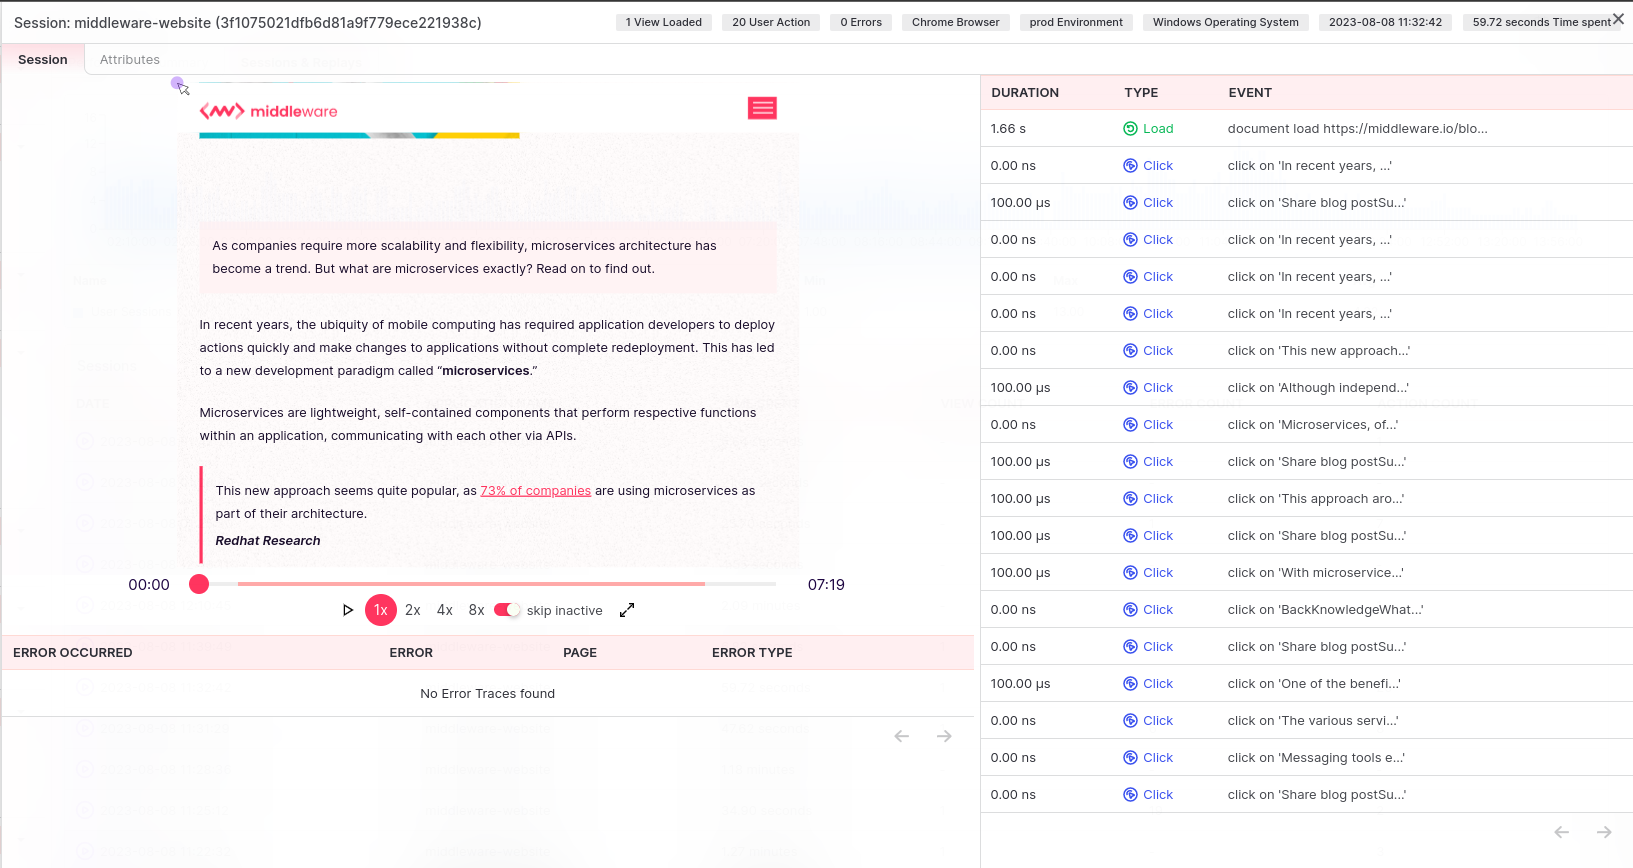
- Recording Playback: If available, watch the recording of the session to gain a firsthand understanding of user interactions.
- Error Groups: Easily pinpoint and categorize errors for quick identification.
- User Activity: View a log of user actions throughout the session.
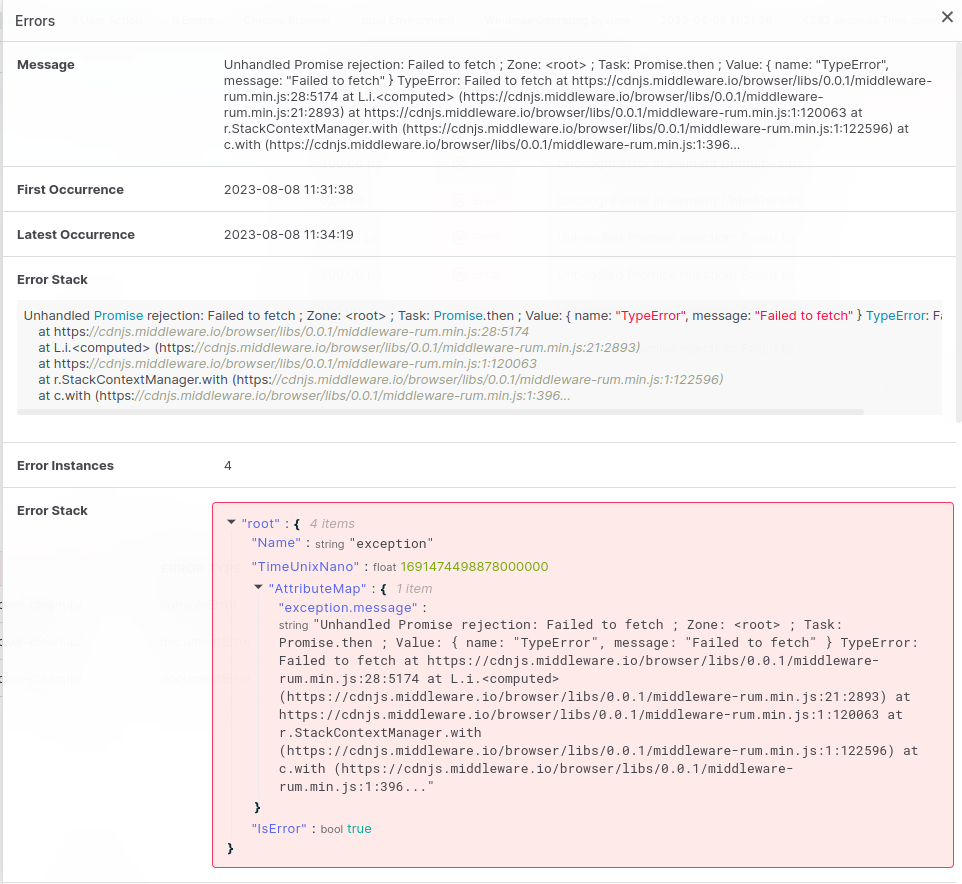
Detailed Error Analysis
For a deeper dive into errors, click on a specific row to access the detailed error stack. This allows you to thoroughly examine the error and its context.