> ## Documentation Index
> Fetch the complete documentation index at: https://mw-docs.middleware.io/llms.txt
> Use this file to discover all available pages before exploring further.
# Common Practices - Alerts
The following guide describes best practices for configuring, maintaining, and managing essential alerts. Let this be the starting point to ensure you are effectively monitoring your system-wide infrastructure data.
# Resource Monitoring Alerts
### CPU Utilization Alert
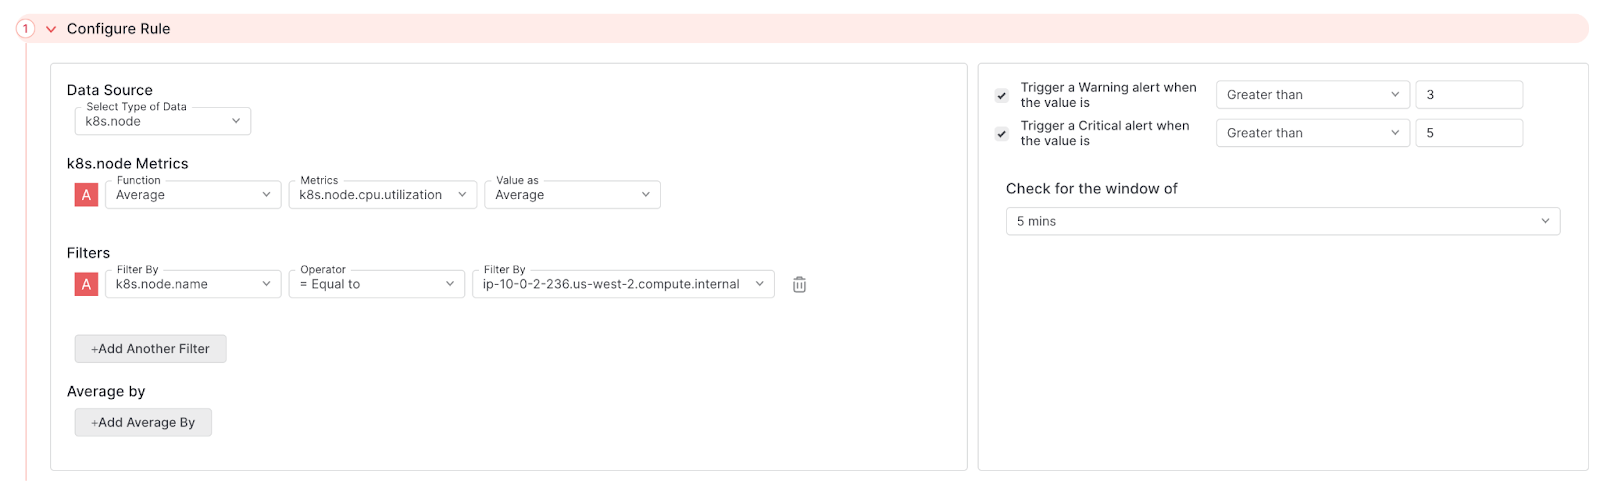
The following alert tracks the average CPU Utilization for a Kubernetes node. This alert is monitoring a single Kubernetes node, specified by the Filter configuration. A Warning alert is fired when `k8s.node.cpu.utilization` surpasses an average CPU Utilization of three mCores on the specified Kubernetes node, while a Critical alert is triggered when `k8s.node.cpu.utilization` surpasses an average CPU Utilization of five mCores. This is checked on a five minute interval.
### Memory Consumption Alert
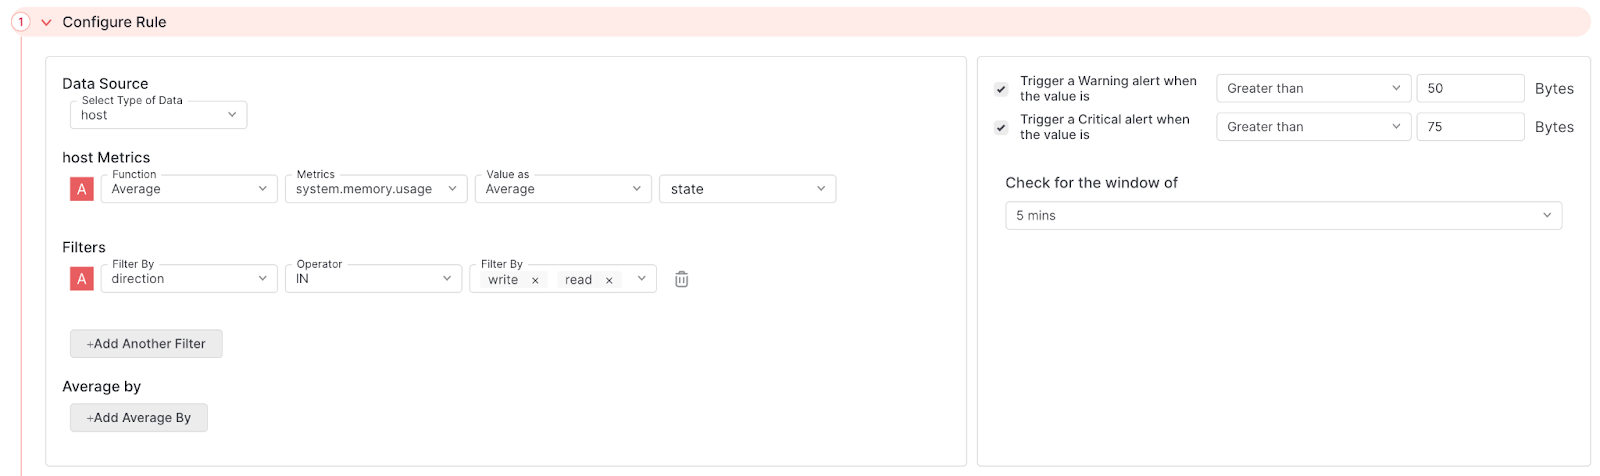
The following alert tracks the average amount of memory used when data is being read and written across your entire system. A Warning is fired when `system.memory.usage` is greater than 50 bytes and a Critical warning when it is greater than 75 bytes. This is checked on a five minute interval.
The **State** filter is left blank so that all state metrics (e.g. buffered, cached, free, etc.) are collected.
### APM Monitoring Alert
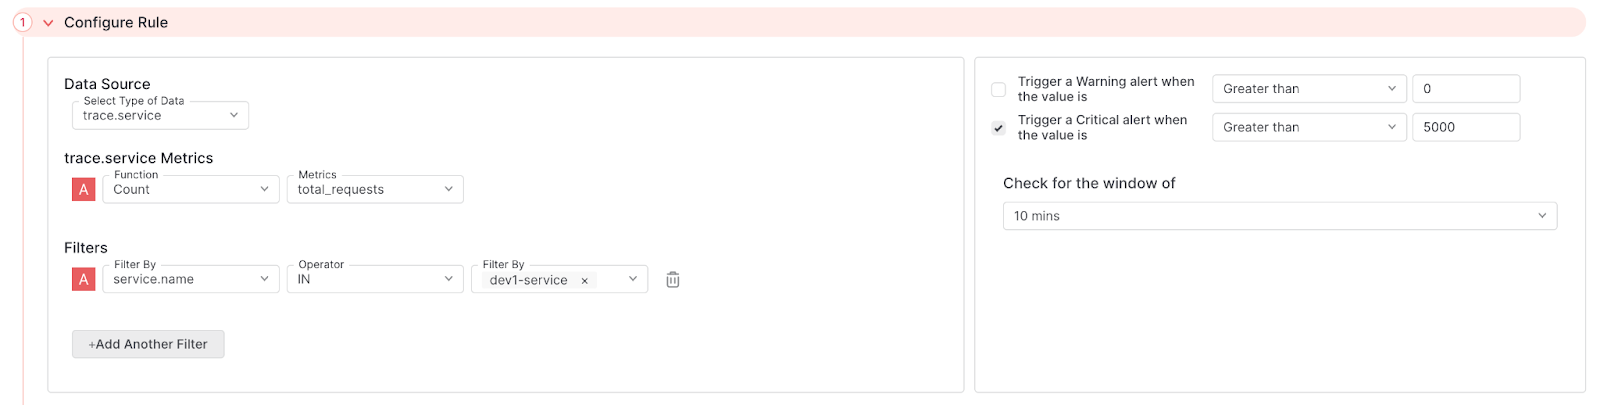
The following alert tracks the total number of trace requests from a single APM. This alert uses the `IN` operator to monitor a specific `service.name` with the Filter configuration. A Critical message is fired when the total number of trace requests exceeds 5,000 in a 10 minute period.
### Log Error Alerts
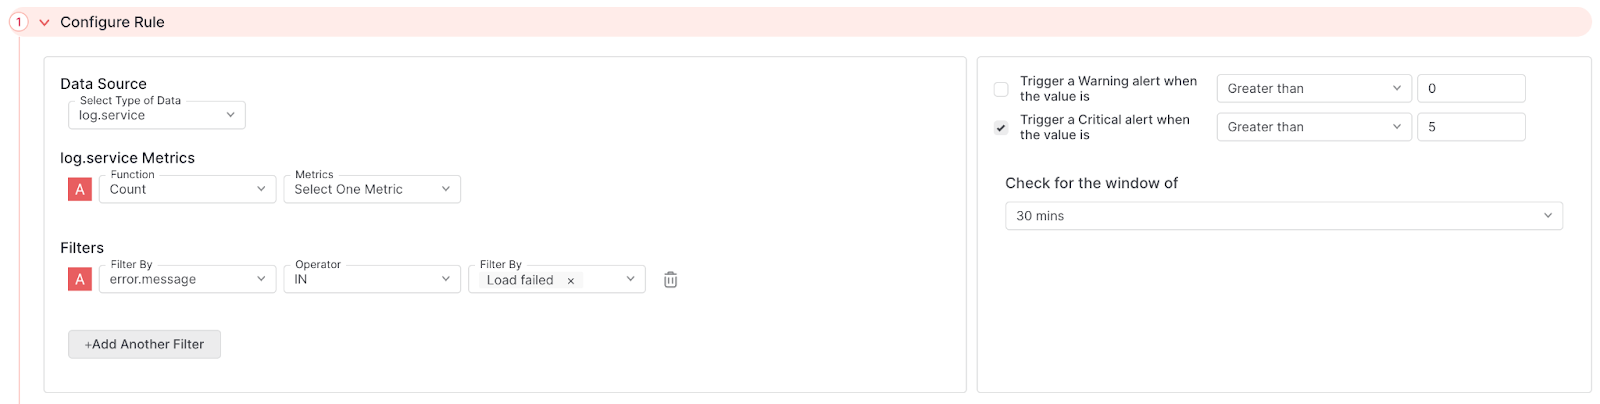
The following alert tracks the total number of logs that contain a message indicating a load failure. This alert uses the `IN` operator to monitor `error.message` with the Filter configuration. A critical message is fired when there are more than five `error.message` that contain the string `Load Failed` in a 30 minute window.
Need assistance or want to learn more about Middleware? Contact us at support\[at]middleware.io.