> ## Documentation Index
> Fetch the complete documentation index at: https://mw-docs.middleware.io/llms.txt
> Use this file to discover all available pages before exploring further.
# Using RUM
Real User Monitoring (RUM) provides direct feedback into the user experience. We track and transmit real-time user interactions and performance metrics directly from your web pages. Learn how RUM empowers us to track user behavior, identify bottlenecks, and continuously improve our digital services.
# Session Recordings
The maximum session and session recording duration is 4 hours. If a user does not interact on the web page being recorded for more than 15 minutes, the session will timeout. Each time a user interacts with the website, an extra 15 minutes is added to the cookie's timer, ensuring the session remains active.
A new session is created when the user interacts with the web page after the 15 minute timer expires or when the session recording time surpasses 4 hours.
Middleware masks user passwords by default. Other text can be masked using the `mw-mask` css class. Masked text will appear as `*******` in the session recording.
# Performance Summary
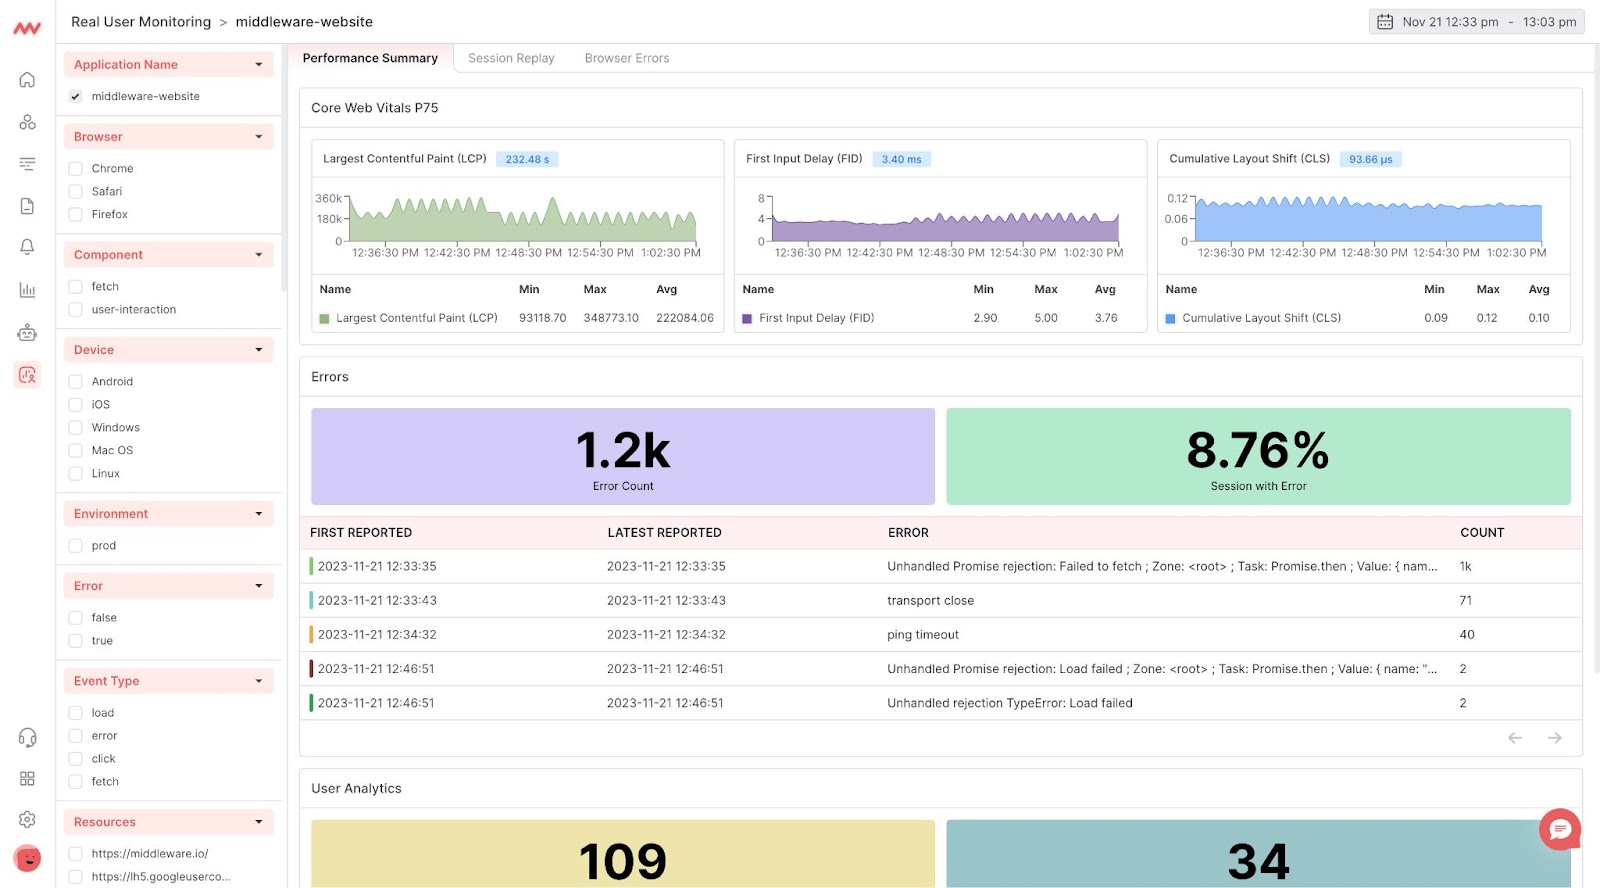
The Performance Summary provides insight into your top-level RUM performance data. This section provides information about your Core Web Vitals, total errors incurred, unique user sessions and pages visits within a certain period of time. Quickly drill into your error stack to isolate and block recurring issues.
# Session Replay
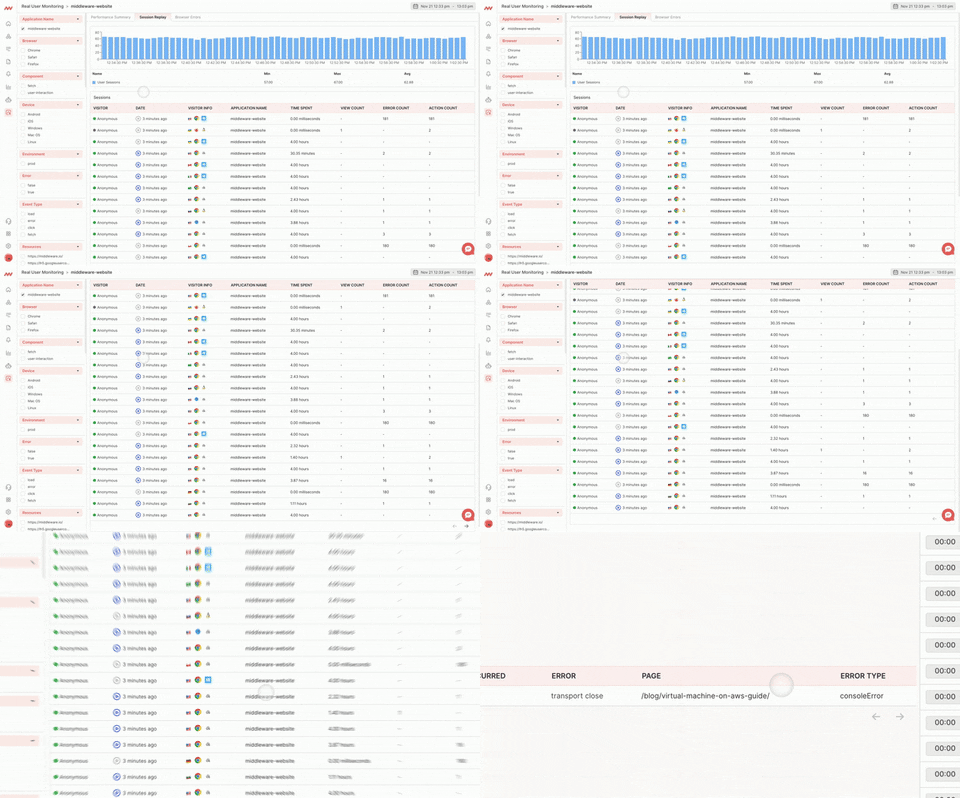
The Session Replay section provides insight into your top-level RUM Session data. From here you can drill into specific session details to easily diagnose issues and understand user behavior.
Select from the Sessions table to drill into a RUM Session. Get time stamped recordings of users' interactions. If you have set up [Trace Correlation](/rum/getting-started#connect-rum-to-tracing) you will also see related backend traces.
 # Browser Errors
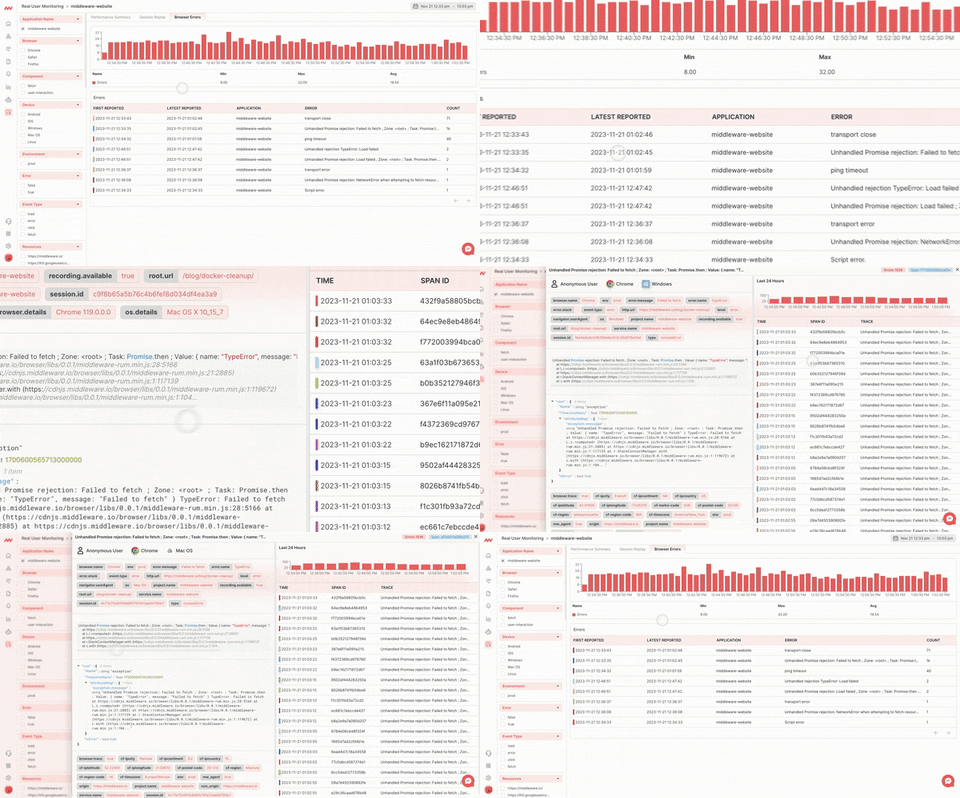
The Browser Errors section provides insight into when and where your application throws Errors. Drill into a single error to identify the traces, browser type, high level infrastructure data and other key data that could be causing errors.
# Browser Errors
The Browser Errors section provides insight into when and where your application throws Errors. Drill into a single error to identify the traces, browser type, high level infrastructure data and other key data that could be causing errors.
 # Alerts
For more information on creating Alerts, navigate to [Creating Alerts](https://docs.middleware.io/workflow/alerting/setup-alert).
To add RUM session data to your alerts, select `traces` as your initial data source and create a filter with the `browser.trace` attribute `equal to` `true`:

Need assistance or want to learn more about Middleware? Contact us at support\[at]middleware.io.
# Alerts
For more information on creating Alerts, navigate to [Creating Alerts](https://docs.middleware.io/workflow/alerting/setup-alert).
To add RUM session data to your alerts, select `traces` as your initial data source and create a filter with the `browser.trace` attribute `equal to` `true`:

Need assistance or want to learn more about Middleware? Contact us at support\[at]middleware.io.