
For more information on the Kafka Integration, navigate to the Kafka Demo Project repository.
Prerequisites
Middleware Host Agent (MW Agent)v 1.5.0+ must be installed on your local machine. To install the MW Agent, see our Installation Guide.
Setup
Step 1: Download Jar File
Download theopentlemetry-jmx-metrics.jar file here.
Step 2: Access Integrations
Login to your Middleware account, navigate to the Kafka integration, and connect Kafka: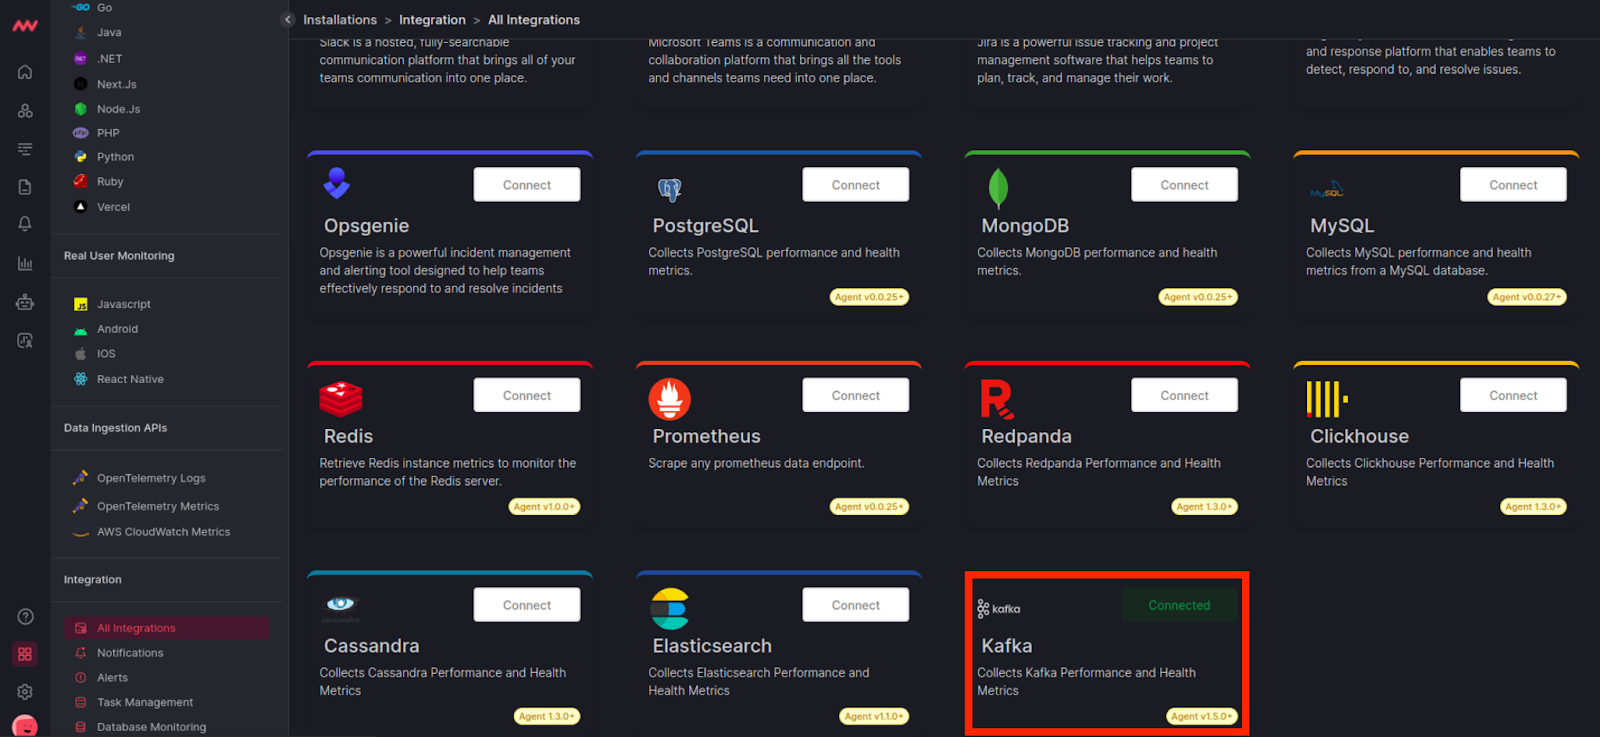
Step 3: Add Kafka Host
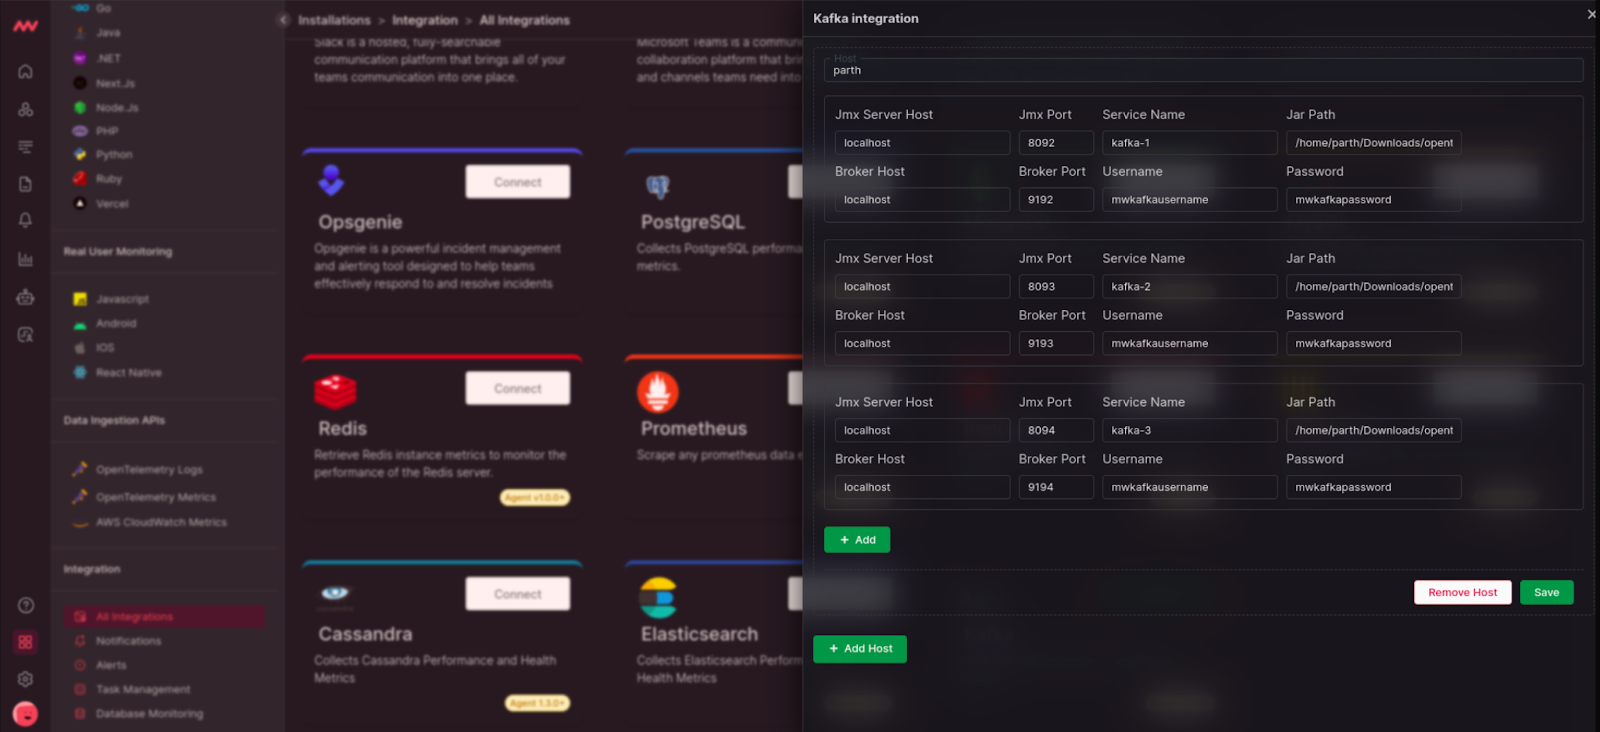
Add your JMX Server and Broker Host configuration to instrument the Kafka Host: For more information on each input field, navigate to the Host Configuration Details section.
Visualize Your Data
Default Kafka Dashboard
Quickly access your Kafka data with Middleware’s default Kafka dashboard. Navigate to the Dashboard Builder and select the Kafka Dashboard: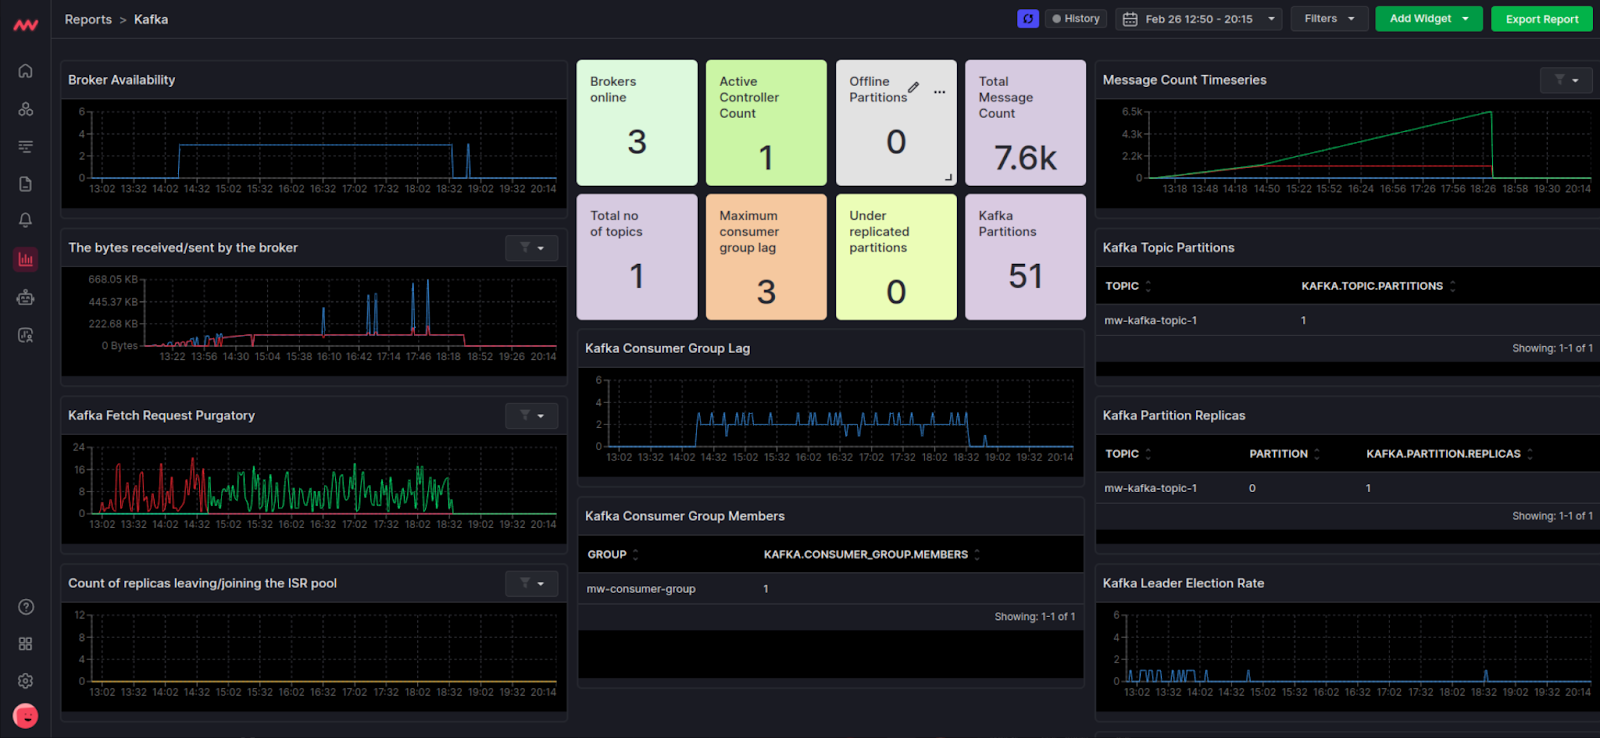
Metrics Collected
Create your own widget from scratch. Navigate to the Dashboard Builder and select the dashboard you would like to create a widget in. Select Add New Widget and choose the Kafka data source.Host Configuration Details
The following describes all input fields required to start streaming Kafka data to Middleware:Next Steps
- How to Create Alerts
- Dashboard Basics & Customization
- Custom Telemetry Ingestion
- Getting Started With Real User Monitoring (RUM)
- Data Ingestion APIs
Need assistance or want to learn more about Middleware? Contact us at support[at]middleware.io.