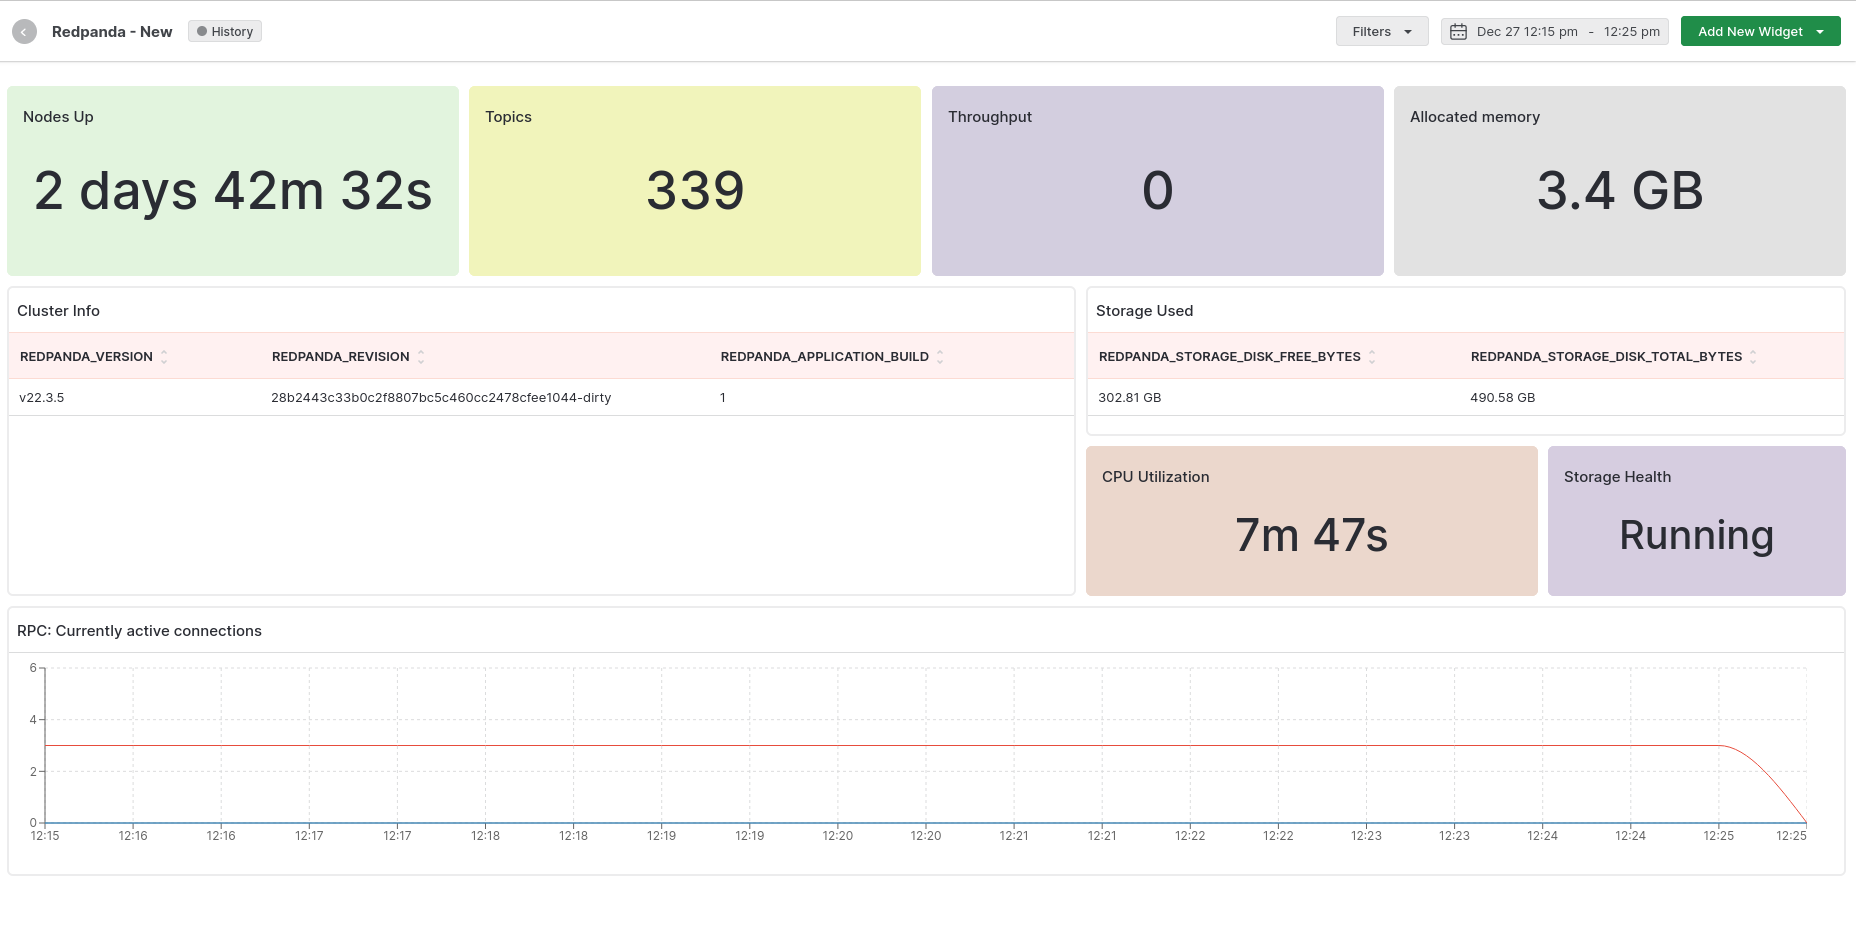
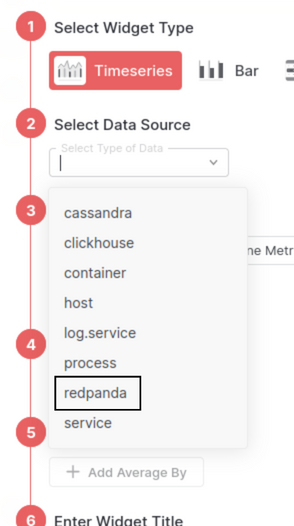
redpanda_application_build | Redpanda build information |
redpanda_application_uptime_seconds_total | Redpanda application uptime in seconds |
redpanda_cluster_brokers | Number of configured, fully commissioned brokers in a cluster |
redpanda_cluster_controller_log_limit_requests_available_rps | Limit on the available requests per second (RPS) for a cluster controller log |
redpanda_cluster_controller_log_limit_requests_dropped | Number of requests dropped by a cluster controller log due to exceeding redpanda_cluster_controller_log_limit_requests_available_rps |
redpanda_cluster_partition_moving_from_node | Number of partition replicas in a cluster being removed from a node |
redpanda_cluster_partition_moving_to_node | Number of partition replicas in cluster being added or moved to a node |
redpanda_cluster_partition_node_cancelling_movements | Number of partition replicas being moved that now need to be cancelled during a partition movement cancellation operation |
redpanda_cluster_partition_num_with_broken_rack_constraint | Number of Redpanda partitions violating rack constraints |
redpanda_cluster_partitions | Number of partitions managed by a cluster. Includes partitions of the controller topic, but not replicas |
redpanda_cluster_topics | Number of topics in a cluster |
redpanda_cluster_unavailable_partitions | Number of unavailable partitions (that lack quorum among their replica group) in the cluster |
redpanda_cpu_busy_seconds_total | Total CPU busy time in seconds |
redpanda_io_queue_total_read_ops | Total read operations passed in the I/O queue |
redpanda_io_queue_total_write_ops | Total write operations passed in the I/O queue |
redpanda_kafka_handler_latency_seconds | Average time for Redpanda to handle Kafka requests |
redpanda_kafka_max_offset | High watermark offset of a partition (for calculating consumer group lag) |
redpanda_kafka_partitions | Configured number of partitions for a topic |
redpanda_kafka_records_fetched_total | Total number of records fetched |
redpanda_kafka_records_produced_total | Total number of records produced |
redpanda_kafka_replicas | Total number of configured replicas per topic |
redpanda_kafka_request_bytes_total | Total number of bytes produced or consumed per topic |
redpanda_kafka_request_latency_seconds | Latency of produce/consume requests per broker. Measures from when a request is initiated on partition to when response is fulfilled |
redpanda_kafka_under_replicated_replicas | Number of replicas in the partition that are live but not at the latest offset, redpanda_kafka_max_offset |
redpanda_memory_allocated_memory | Total allocated memory in bytes |
redpanda_memory_available_memory | Total memory potentially available (free plus reclaimable memory) to a CPU shard (core) in bytes |
redpanda_memory_available_memory_low_water_mark | The low watermark for available memory at process start |
redpanda_memory_free_memory | Available memory in bytes |
redpanda_node_status_rpcs_received | Number of node status RPCs received by a node |
redpanda_node_status_rpcs_sent | Number of node status RPCs sent by a node |
redpanda_node_status_rpcs_timed_out | Number of timed out node status RPCs from a node |
redpanda_raft_leadership_changes | Number of leadership changes across all partitions of a given topic |
redpanda_raft_recovery_partition_movement_available_bandwidth | Bandwidth available for partition movement, in bytes per second |
redpanda_rest_proxy_request_errors_total | Total number of REST proxy server errors |
redpanda_rest_proxy_request_latency_seconds | Internal latency of REST proxy requests |
redpanda_rpc_active_connections | The total number of currently-active clients the RPC server on a given shard has connections to |
redpanda_rpc_request_errors_total | Number of RPC errors |
redpanda_rpc_request_latency_seconds | RPC latency in seconds |
redpanda_schema_registry_request_errors_total | Total number of Schema Registry errors |
redpanda_schema_registry_request_latency_seconds | Latency of the request indicated by the label in the Schema Registry. The measurement includes the time spent waiting for resources to become available, processing the request, and dispatching the response |
redpanda_storage_disk_free_bytes | Available disk storage in bytes |
redpanda_storage_disk_free_space_alert | Alert for low disk storage: 0: OK, 1: low space, 2: degraded |
redpanda_storage_disk_total_bytes | Total size in bytes of attached storage |