This guide provides an overview of Middleware’s Infrastructure Monitoring page. Collect, configure, and visualize complex telemetry across your Infrastructures with our autodetection capabilities. The Middleware Host Agent auto collects data across your stack using the OpenTelemetry framework. While collecting, the Agent will compress and batch data to your account to allow near real time analysis on all data points regarding your clusters, nodes, pods and services. Middleware supports Infra Monitoring on many distributions, which can be found here.Documentation Index
Fetch the complete documentation index at: https://mw-docs.middleware.io/llms.txt
Use this file to discover all available pages before exploring further.
Key Concepts
Host List
The Host List is the highest level component overview, providing a top-down approach for diagnosing, monitoring, and maintaining your stack. It provides insights into your orchestration data, database usage, system-wide Infrastructure utilization and general health of your stack.Containers
The Containers section provides visibility into the health and performance of your containerized workloads. Middleware collects Container data based on the VMs running in your infra. This does not include containers managed by Kubernetes.Processes
Processes are system level programs being executed inside of your hosts or containers. This data is pulled directly from your operating system and imported to Middleware through the Host Agent. You may use this data to analyze process health, overall process impact, and drill into each process to uncover further data points.Kubernetes
Kubernetes is a container orchestration platform that automates the deployment, scaling, management, and operation of containerized applications. Our Middleware Agent runs as a Kubernetes DaemonSet that collects and transmits data.Clusters
Clusters
A cluster is a collection of nodes that operate together as a single unit. These include control plane components and nodes that run the actual workloads.
Nodes
Nodes
A node is a physical or virtual machine within a Kubernetes cluster where containers are deployed and run.
Services
Services
A service defines a particular set of pods and provides a consistent network endpoint to access them. A service can be used for load balancing, service discovery, and a layer of abstraction for connecting to applications within a cluster.
Workloads
Workloads
A workload is a tool for managing the configuration and scale of your application components within a Kubernetes cluster.
Pods
Pods
Pods are the smallest deployable unit in Kubernetes. They represent one or more containers that share the same network namespace, storage, and IP address. Pods are scheduled onto nodes.
Containers
Containers
Containers are the fundamental units running with pods, which are scheduled onto nodes in a Kubernetes cluster.
Deployments
Deployments
Deployments provide declarative updates to applications. They are a high-level abstraction that simplifies the management and scaling of applications.
ReplicaSets
ReplicaSets
ReplicaSets ensure a specified number of replica pods are running at any given time. ReplicaSets can be used for horizontally scaling your applications.
Jobs
Jobs
Jobs are controller objects that represent finite and short-lived tasks or batch processes that run within pods.
CronJobs
CronJobs
CronJobs are controller objects that can be scheduled to automate task execution. CronJobs are Jobs that can be run on a periodic schedule.
DaemonSet
DaemonSet
DaemonSets are controllers that ensure a specific set of pods is running across your cluster. DaemonSets are used to run exactly one instance of a pod on each node in the cluster.
StatefulSet
StatefulSet
StatefulSets are used for managing stateful applications that are comprised of unique network identifiers, persistent storage, and specific ordering requirements for their deployment and scaling.
Usage Graph
The Usage graph is a timeseries representation of data from across your Infrastructure. Gain immediate insight into your stack’s performance with the Usage Graph, which by default allows summaraziation by CPU or Memory usage, and a date range picker to drill into a specific timeframe.Change Usage Type
Toggle between your Infrastructure CPU and Memory usage over time.
Select Date Range
Select your own date range from the calendar or choose from our default options.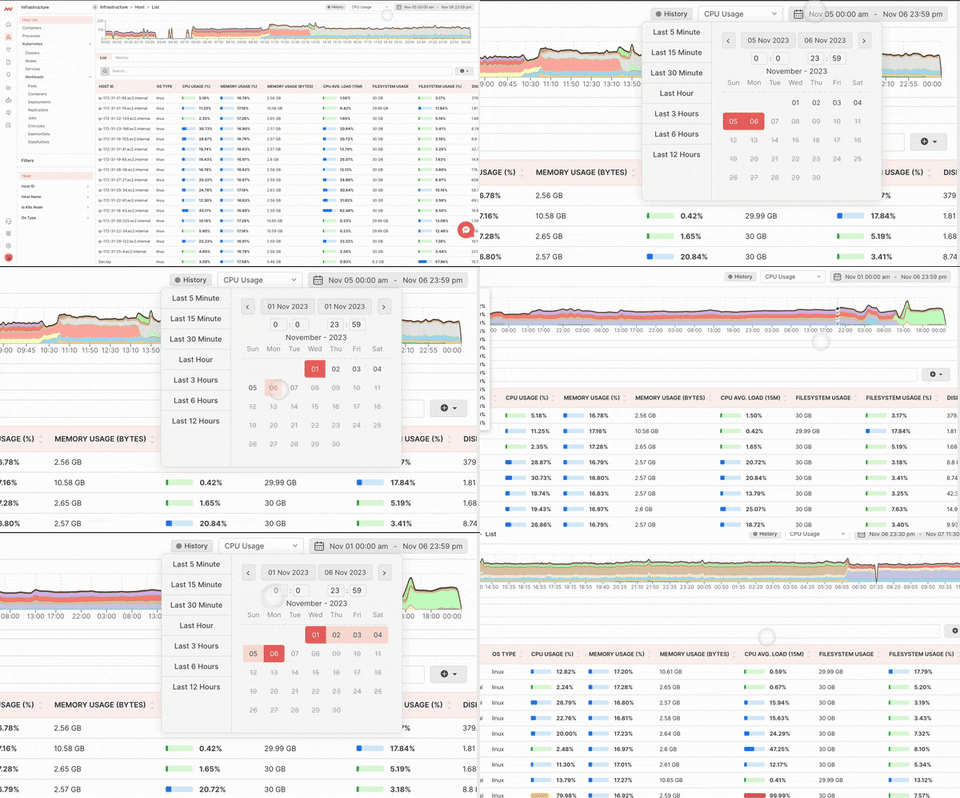
Data Table
The Data Table section displays all Infrastructure data in a single table. Tailor your experience by adding and removing specific metrics, filtering your data to quickly drill into important Infrastructure issues, and toggle between displaying data in real-time or from a static timeframe. Quickly isolate high level issues and drill into them to identify root cause.Add & Remove Data
Select specific Infrastructure data you would like to see in your data table by toggling on and off each attribute or metric.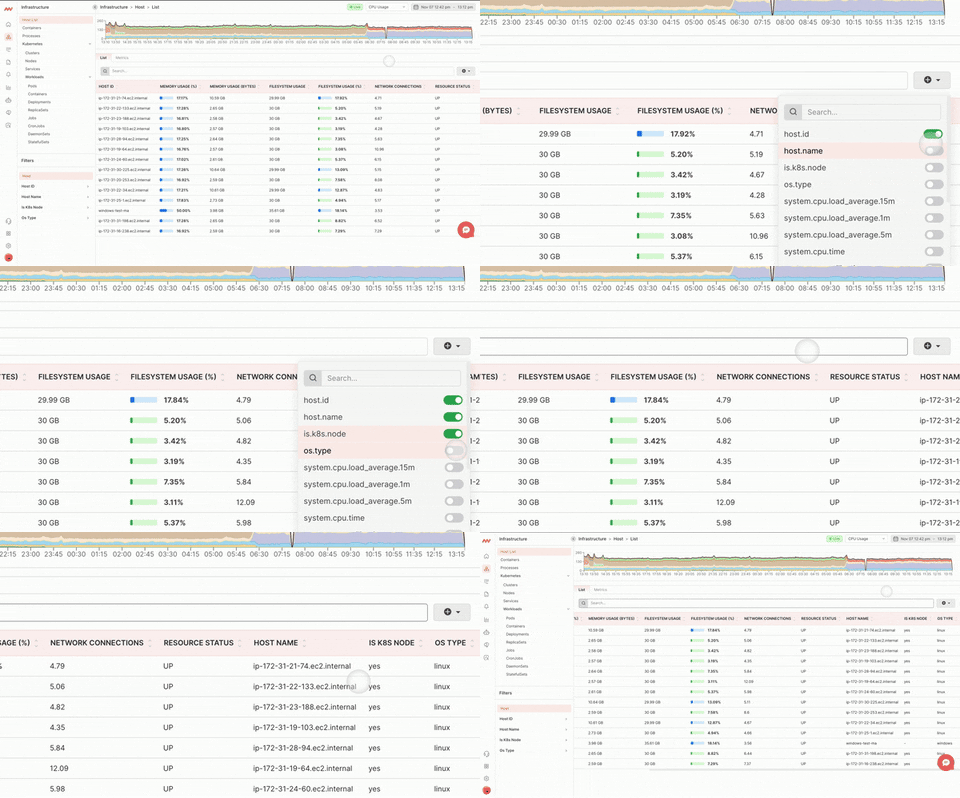
Filter & Search
Access specific Hosts, Host IDs, Host Names, Kubernetes Nodes, OS Types, and other key attributes with the Filters bar. Quickly index across all of your infrastructure data in one search.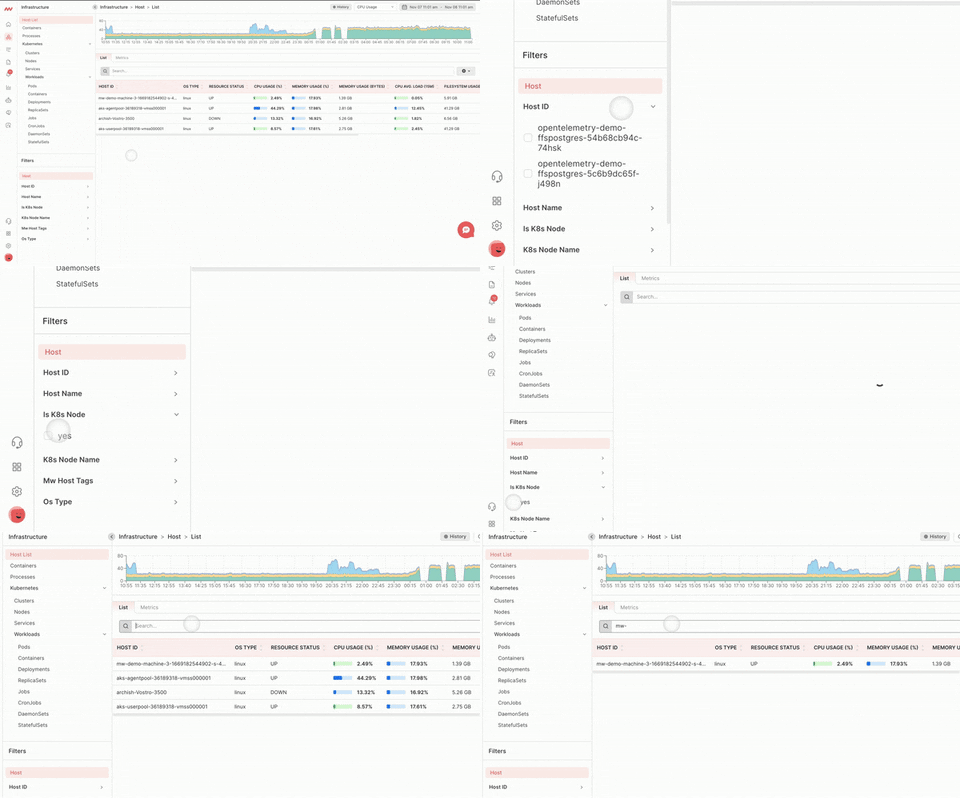
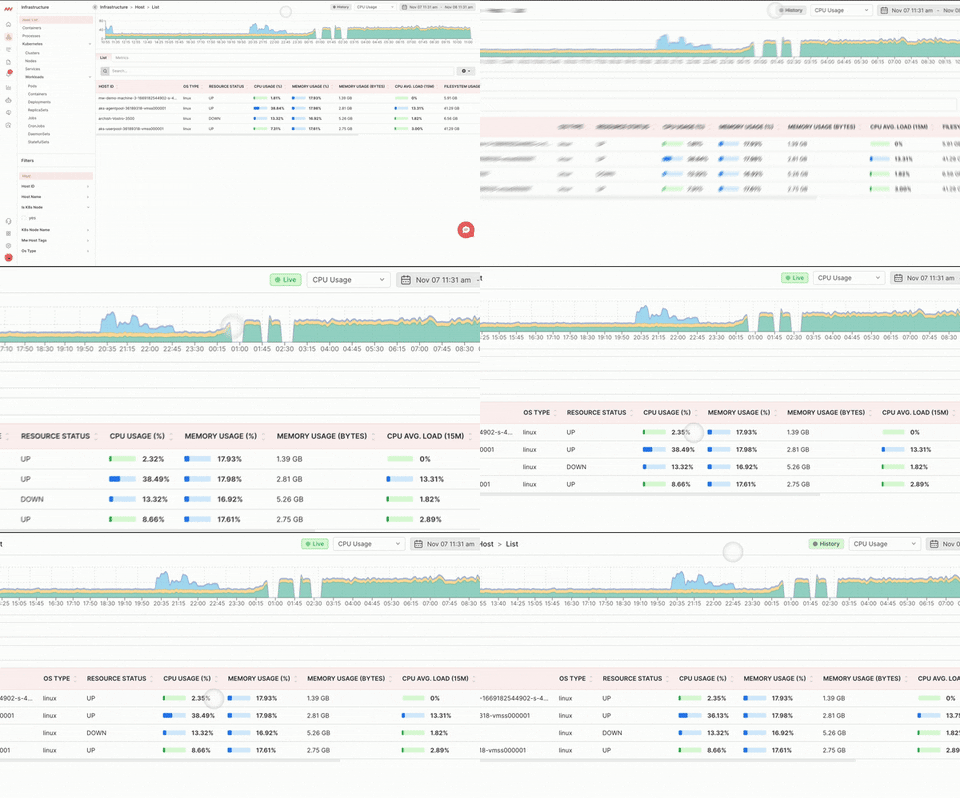
Live & History View
Toggle between a static timerange with the History View or track your Infrastructure data in real-time with Live View. When you select a specific date range, you will be viewing your data in History View. Deselect the date range you previously specified to switch back to Live View.
Drilling Into Your Data
The below section describes some of the many ways you can drill into your data. By default Middleware connects data across your stack using attributes and span and thread ids to ensure a drillable experience across all components. This enables users to have an easy path to root cause regardless of where they start their exploration. In the examples below you’ll see how to drill into the Host List and Kubernetes Data, however, the drill is available from any data point across the Data table.Drilling Into Host List Data
The following example will show you how to drill into a specific Host to better understand the associated components. When drilling into the Host, Middleware by default associates data across all Metrics, Pods, Containers, Processes, Logs and Services.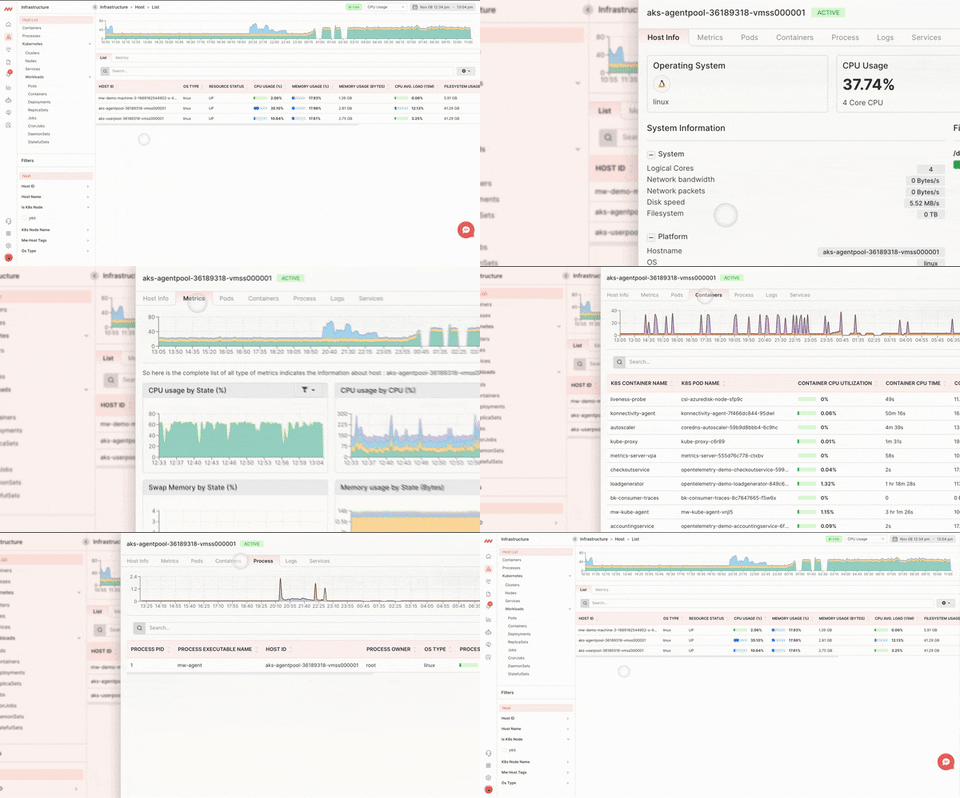
Drilling Into Kubernetes Data
The following example will show you how to drill into your Kubernetes Infrastructure. When drilling into Kubernetes data, Middleware by default associates data across Clusters, Nodes, Services, and Workloads.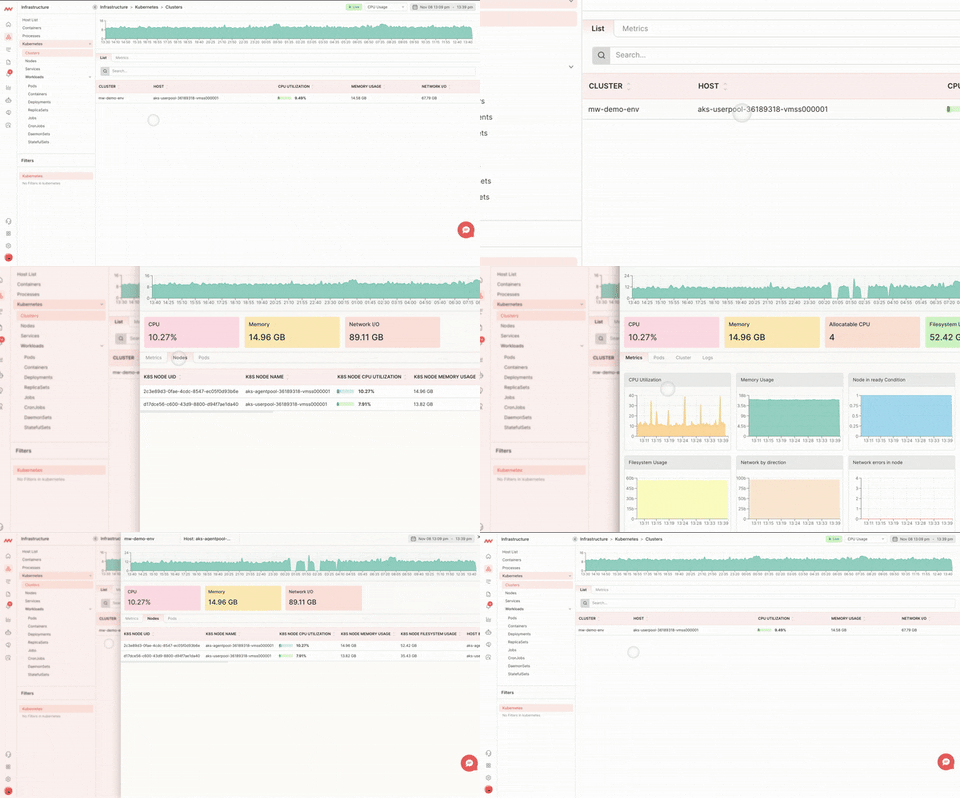
Need assistance or want to learn more about Middleware? Contact us at support[at]middleware.io.