Using the Search bar
Attribute to Value Matching
The search bar allows you to dynamically select data that has been generated within the page you are searching through. Your instrumented applications contain a default set of attributes that are collected and stored within Middleware that correspond to dynamically generated values. Begin your search by clicking into the search bar, selecting your desired attribute, and then choosing a corresponding value that appears shortly after selecting said attribute:Logical Operators
Below is a table containing the available logical operators you can use within the search bar:| Operator | Description |
|---|---|
AND | Intersection: Both terms must be present within the selected search |
OR | Union: Either term is contained within the selected search |
Regex Operators
Regular Expression (Regex) operators allow you to identify specific patterns of strings within your instrumented application data. Refer to the following Syntax Page to learn about the regex syntax that Middleware supports.
Filtering Data with Attributes
The left navigation bar allows you to filter down the data being monitored within a given page. There are preset filters made available across different sections in Middleware as well as dynamically generated filters based on your component’s different resource attributes. To filter your data, check the boxes next to your desired filters to inclusively select the data you would like to view.Filtering by Date Range
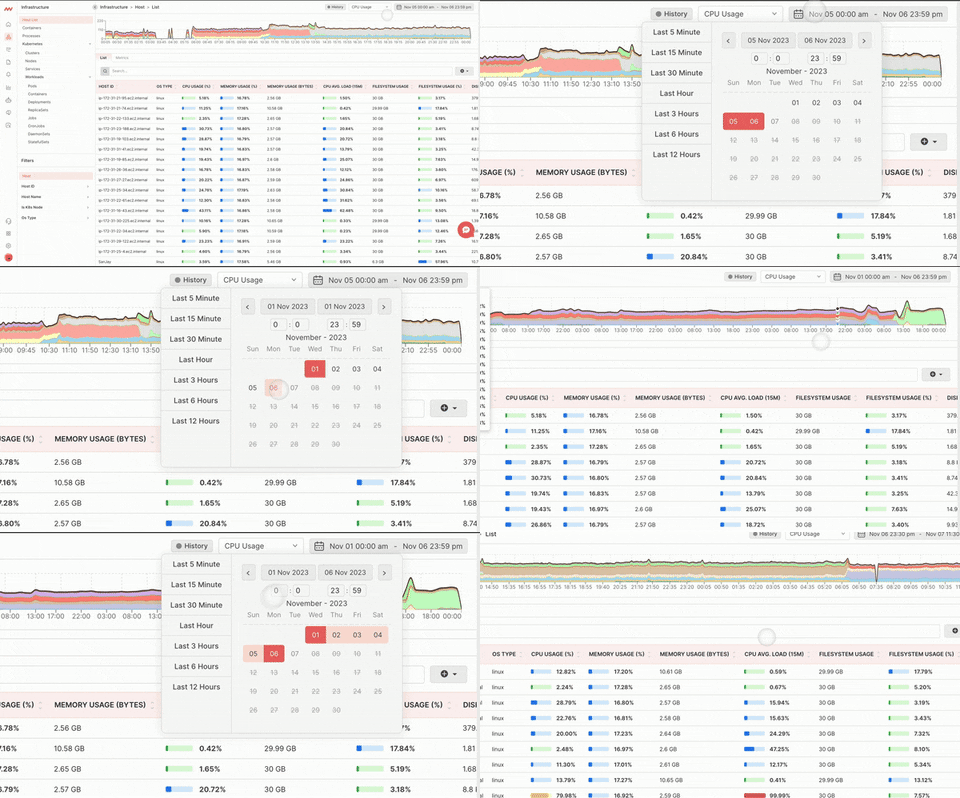
All screens in Middleware include a date range picker in the top right. All other graphs within that dashboard will now be set to the time range you selected in that original graph. Select your own date range from the calendar or choose from our default options:
History & Live Mode
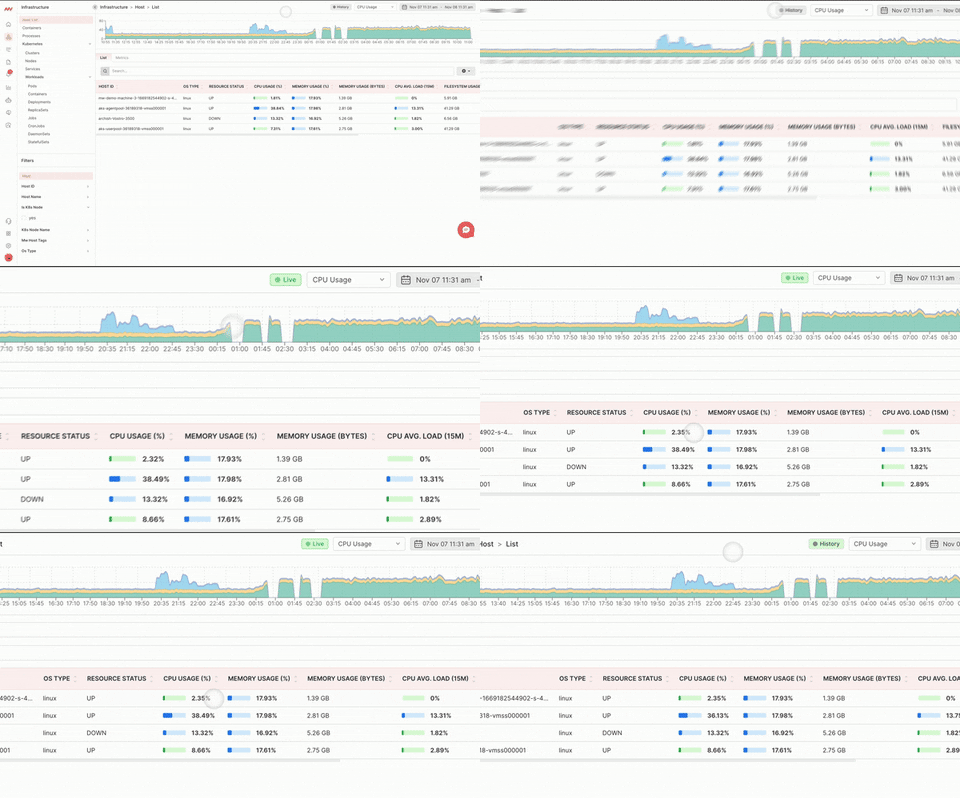
Toggle between a static time range with the History Mode or track your data in real-time with Live Mode. When you are in Live Mode your page will display the last 5 minutes of data while streaming in five second batches.Live Mode can be toggled on or off in the top right by clicking the History/Live button.

Timeframe Selection
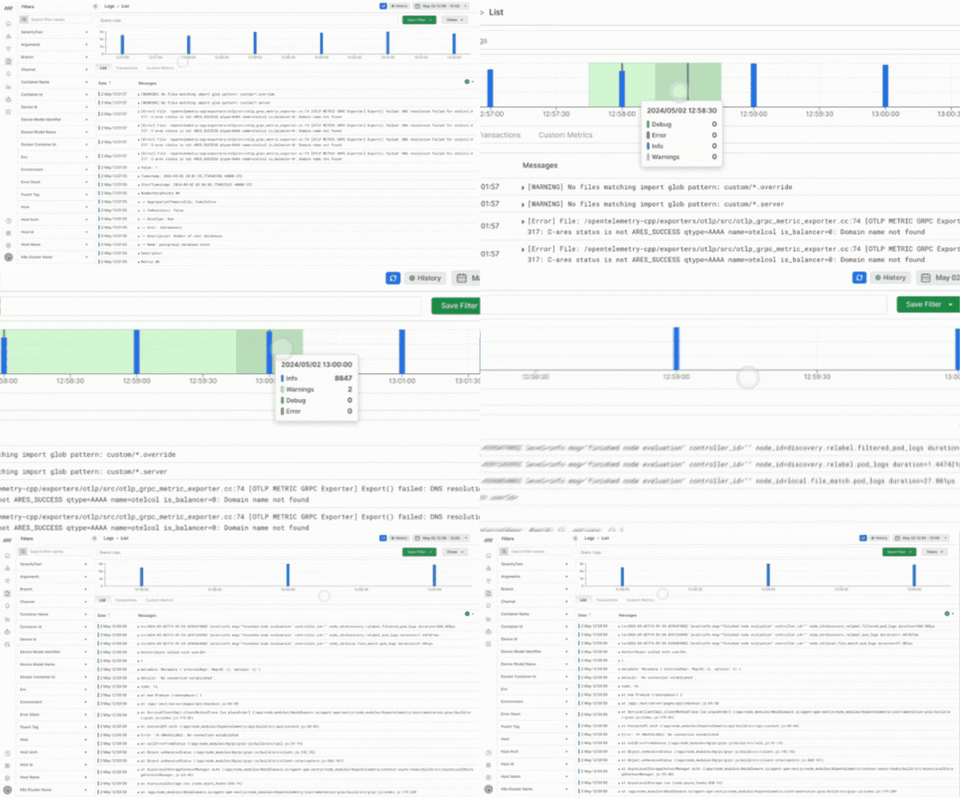
All histograms in Middleware are capable of time range selection. Simply click and drag your cursor over the desired range to drill in:
Filter By Project
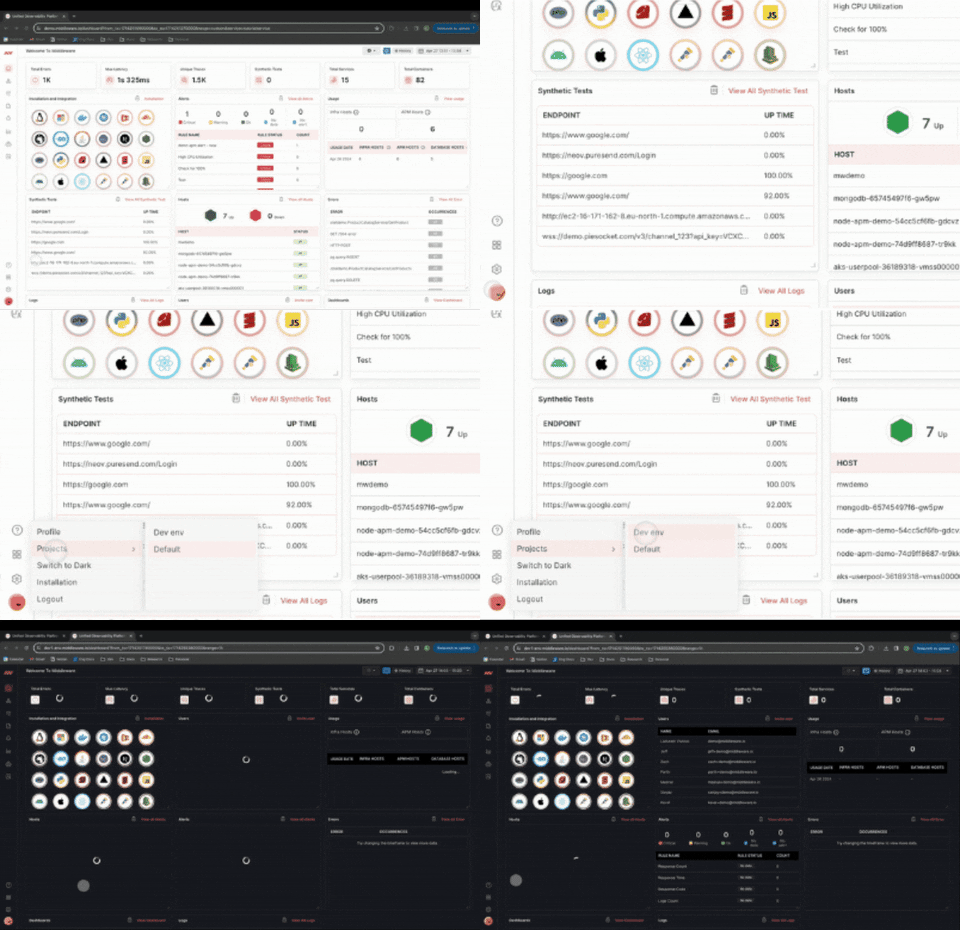
Projects allow you to filter your team’s data based on the projects your organization is working on. Projects give users the ability to silo the data they collect based on the teams that are working on and monitoring that data. For more information on creating projects, navigate to the Settings - Projects page.

Next Steps
- Drilling Into Your Data
- Creating a Project
- Infrastructure Monitoring
- APM Overview
- RUM Overview
- Log Monitoring Overview
- Alert Overview
- Dashboard Builder
Need assistance or want to learn more about Middleware? Contact us at support[at]middleware.io.