Overview
Install the Middleware agent in your Kubernetes clusters to start collecting your cluster and application metrics, traces, and logs.Kubernetes
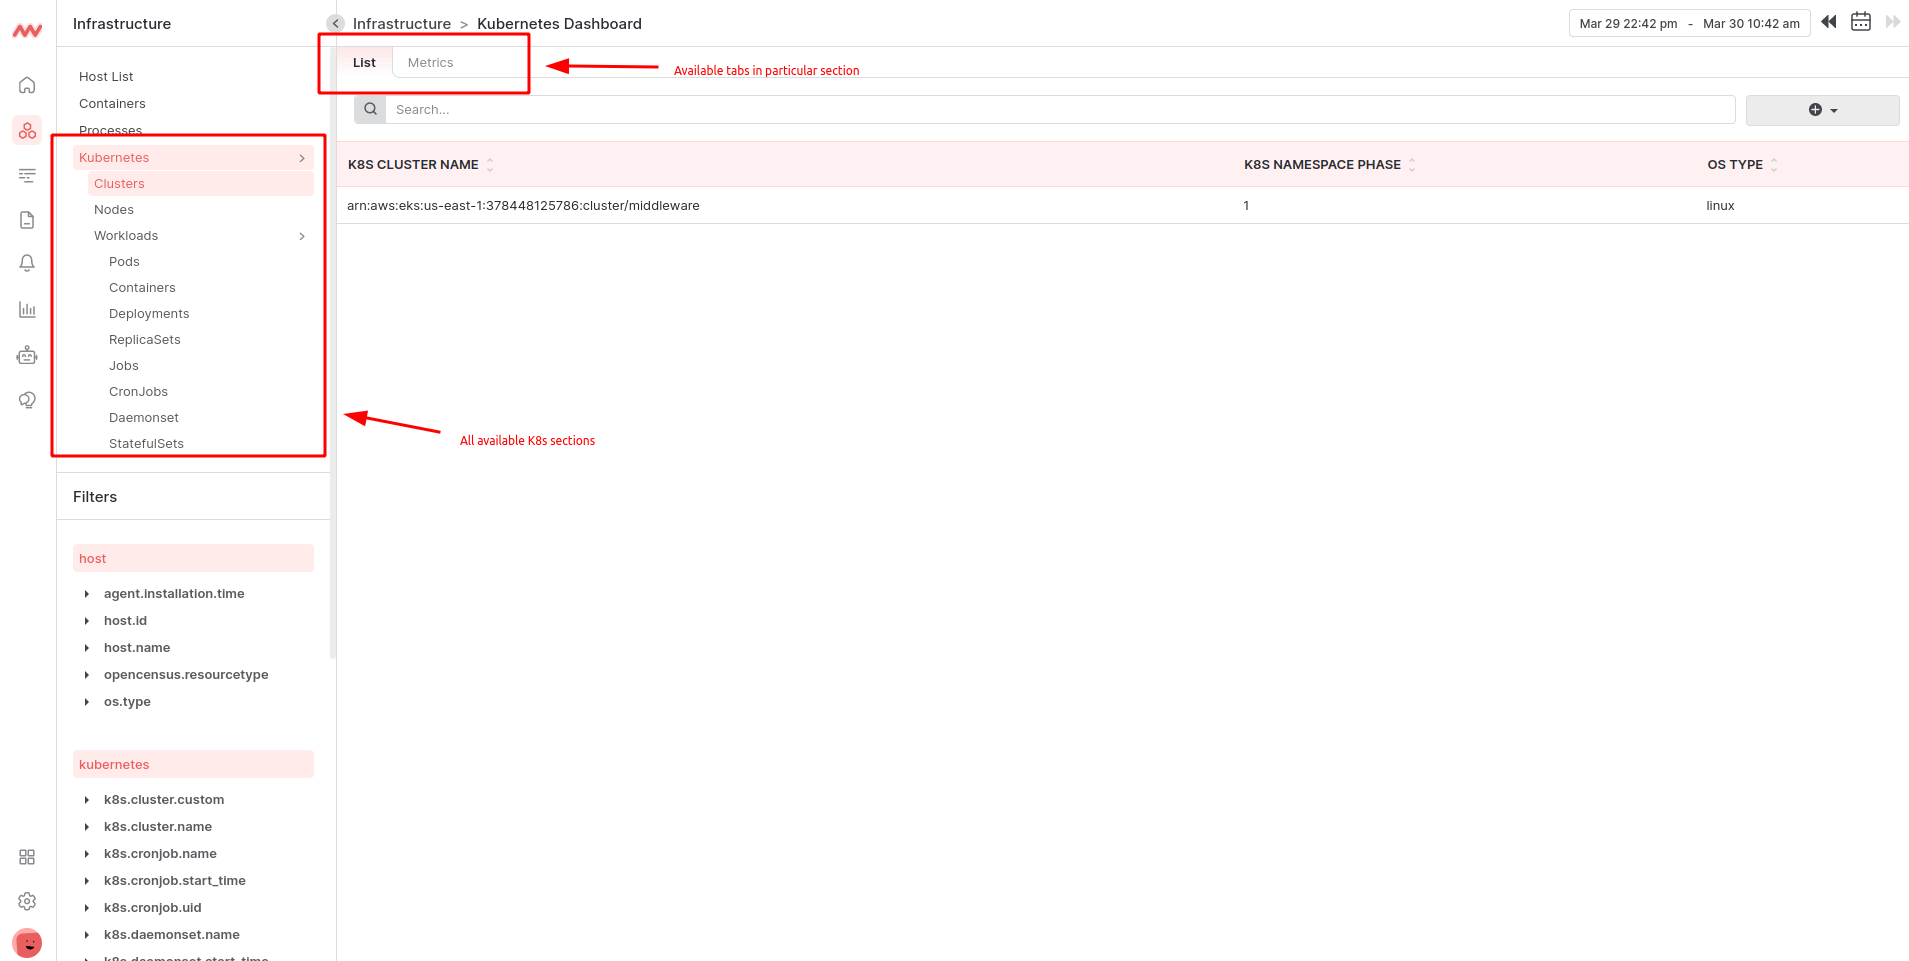
The Kubernetes infrastructure section will display all available k8s data that is available and gathered using our K8s agent. To see this data, you need to install Middleware K8s agent. Following are the default screens in K8s:- K8s Cluster Details
- K8s Node Details
- K8s Containers Details
- K8s Deployment Details
- K8s Replicasets details
- K8s Jobs Details
- K8s Cron Jobs Details
- K8s Daemonsets Details
- K8s Statefulsets Details
- Listing: This section contains all data of a particular part. Like K8s Cluster details listing part will have a cluster listing
- Metrics: This is basically a Custom Dashboard where you can select metrics from all available metrics from which you can select any metric related to this particular section or any other section. You can create metrics that matter to you and add them as a dashboard. Read this to know more about how to create a custom dashboard.
Kubernetes details
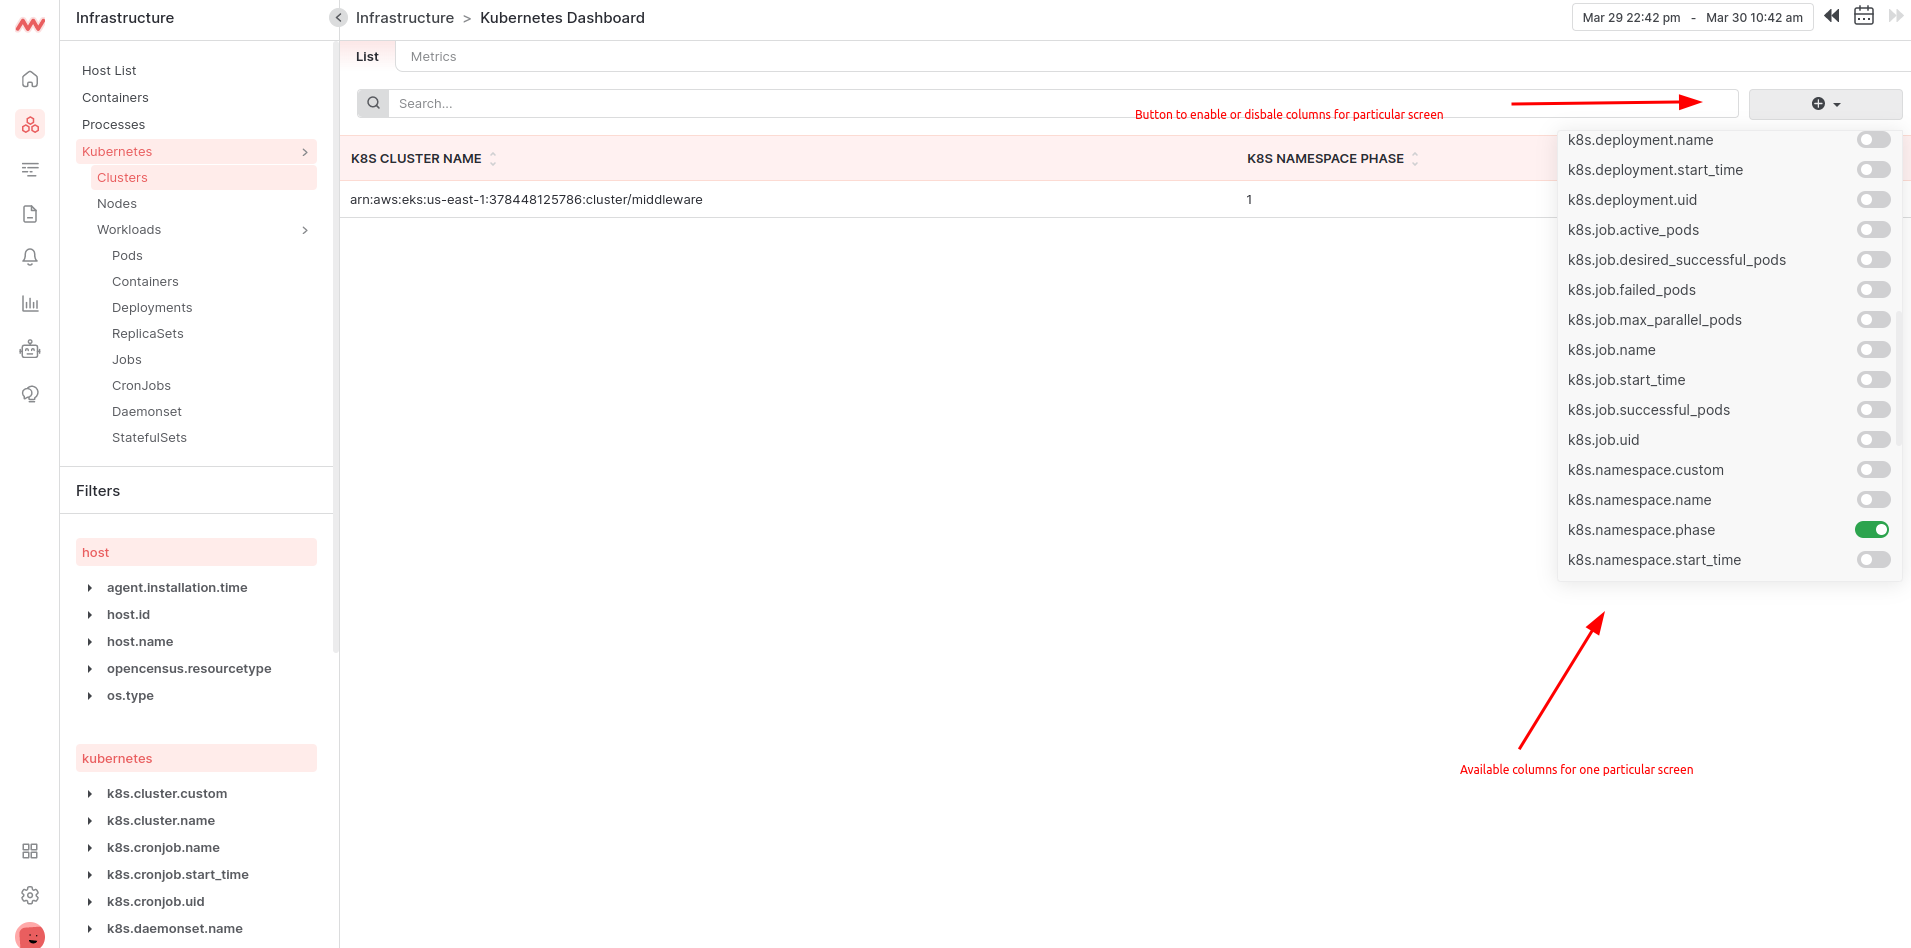
- Each screen contains its own particular detailed information. Ex. Cluster screen contains all K8s cluster details or Pods screen contains all k8s pods details and so on
- By default, we have selected columns for each screen which are imp
- You can customize columns selections from the top right button where you will get all extra columns available for that particular screen details
- These columns depend on data received from the K8s agent and are available in your infrastructure
- You can turn on or off any column from the menu and that will persist in your account.
- You can apply a date filter to see data for a selected time range or search from the search bar to filter out data.
- Use filters to filter the data as per your need.
Need assistance or want to learn more about Middleware? Contact us at support[at]middleware.io.