Overview
Middleware’s log monitoring system helps you to collect logs across multiple sources such as your server, container, cloud environment, and application. You can easily collect, process, explore, and monitor logs with Middleware in real time. Get a visual representation of the logs and search for specific logs and filter the log messages based on different criteria.Setup
To set up log monitoring at the infrastructure level, you need to install the agent, and to monitor logs at your application level, you can configure your application.Log List
This Section will show the recent logs as per the mode, If Live mode is on then you will see all the coming logs & If History mode is on then it will show the logs based on the selected time frame. you can modify it with available filters & you can categories your logs based on App & Infra filter. Log listing includes metadata such as timestamps, log levels, FingerPrint Id’s, and other contextual information that can help you understand the context in which a log entry was generated.
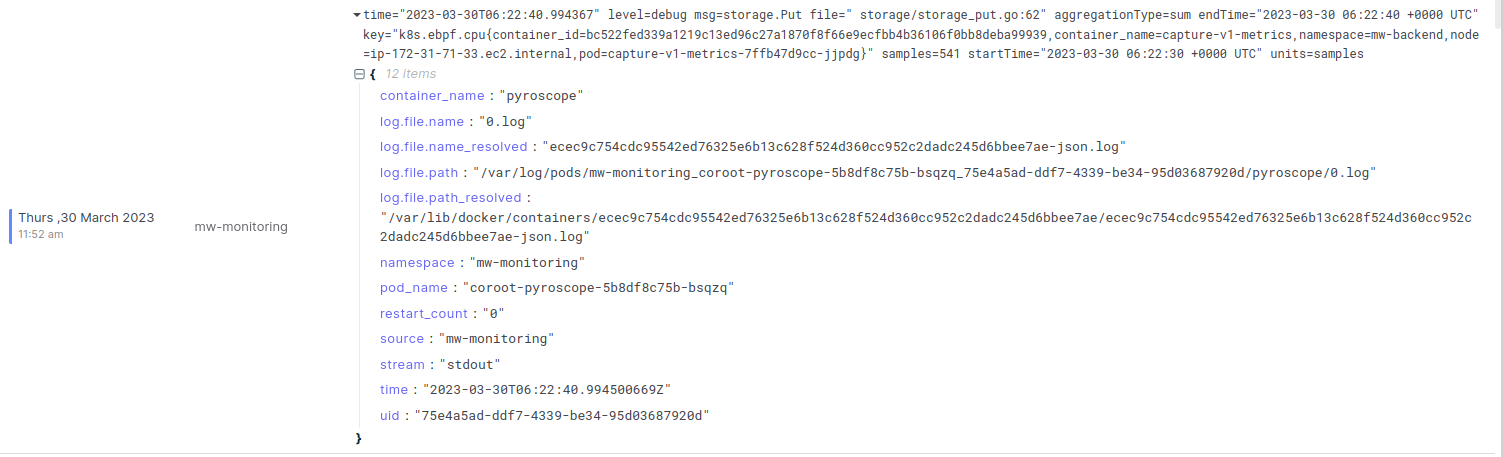
The listing is displayed in a table with 3 columns consisting of the Date/Time of the log, Source from which the log is generated and the Message where the body of the log is displayed.
In addition to this logs usually contains some attributes in a key value format. In listing it can be accessed via 2 ways. Each logs in the list can be opened via given Accordion or it can be clicked to see all the necessary info of the logs in a Dialog.
Log listing includes metadata such as timestamps, log levels, FingerPrint Id’s, and other contextual information that can help you understand the context in which a log entry was generated.
The listing is displayed in a table with 3 columns consisting of the Date/Time of the log, Source from which the log is generated and the Message where the body of the log is displayed.
In addition to this logs usually contains some attributes in a key value format. In listing it can be accessed via 2 ways. Each logs in the list can be opened via given Accordion or it can be clicked to see all the necessary info of the logs in a Dialog.
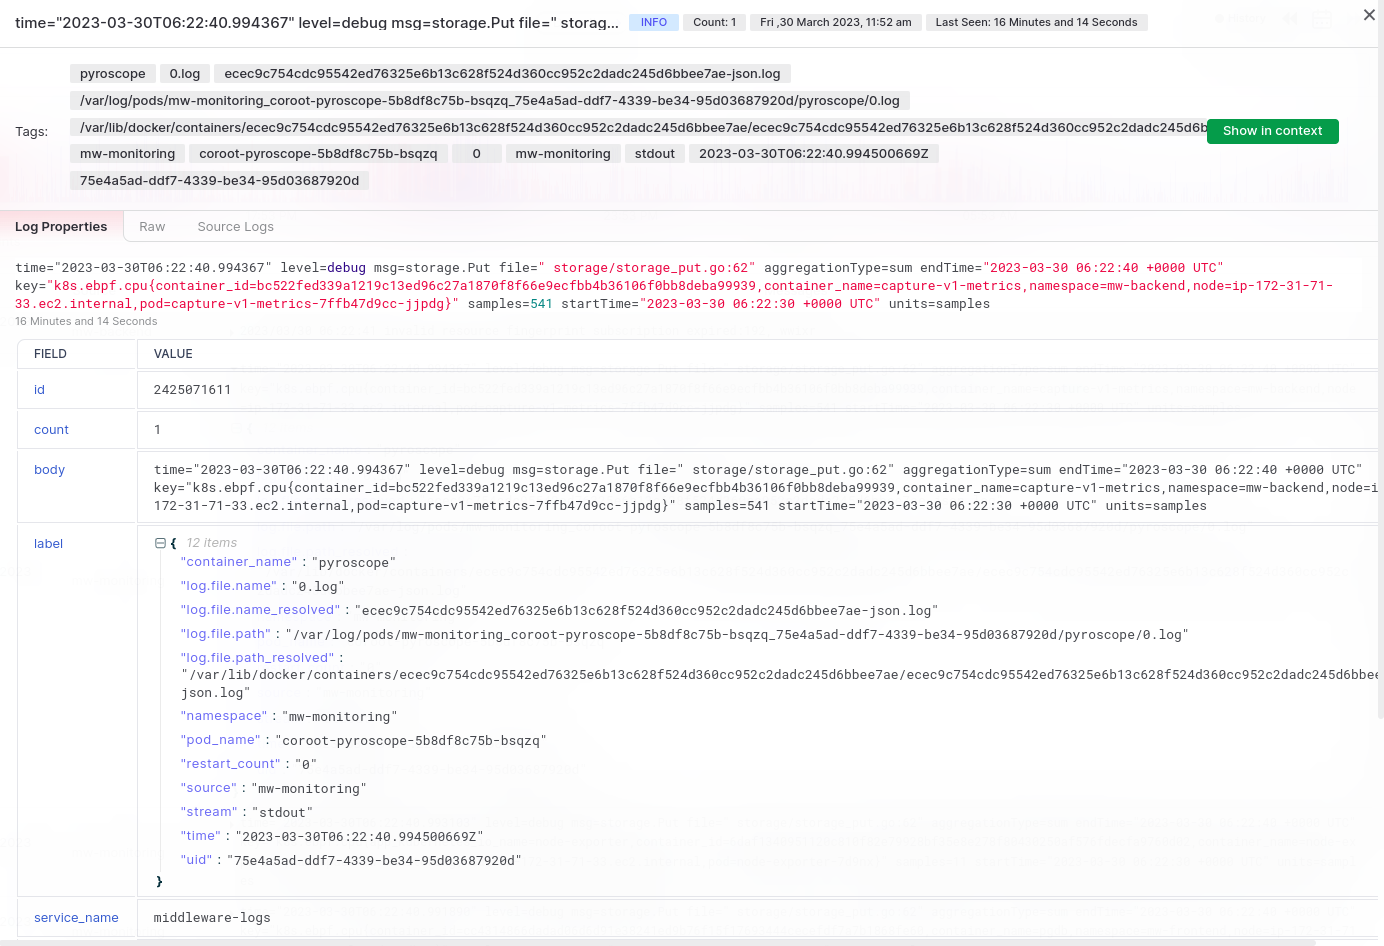
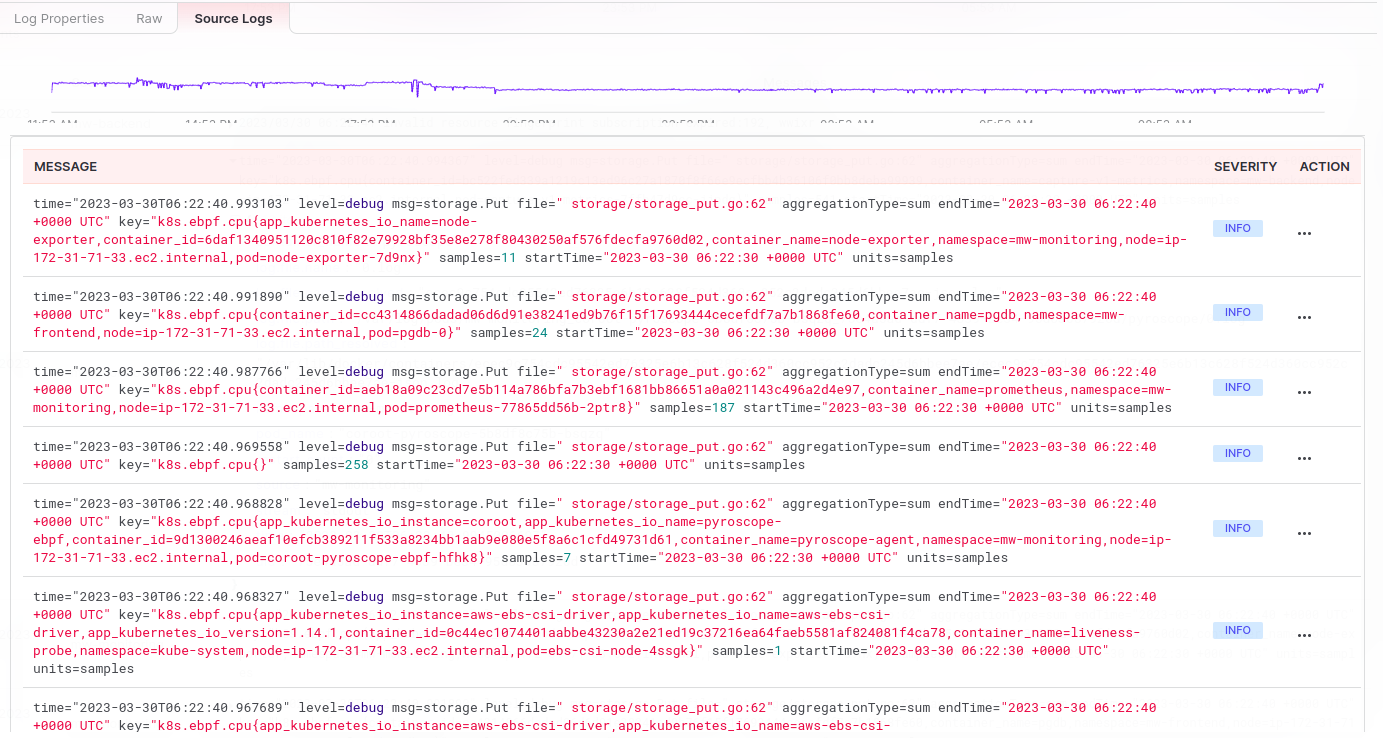
 On click of any log entry the Dialog will appear for that Particular Log. The Dialog contains all the necessary details of the logs along with a tab Source Logs where one can check all the logs from the same source along with a 24 Hour Timeline.
Log Timeline
The logs timeline graph is a visualization tool in Logs Monitoring screen to display logs data over time. It provides a chronological view of log events, allowing you to easily identify patterns, trends, and spikes in log activity.In addition to displaying log data over time, log timeline graph also includes zooming, panning, and filtering, allowing you to focus on specific time ranges or log entries of interest.
 Logs timeline graph plots log data on a two-dimensional coordinate system, with time represented on the x-axis and log count, severity, or other metrics represented on the y-axis. Each log entry is represented as a point on the graph, with its position indicating the time of occurrence and its size or color indicating the severity or count of logs at that point in time.
you might use a logs timeline graph to:
Logs timeline graph plots log data on a two-dimensional coordinate system, with time represented on the x-axis and log count, severity, or other metrics represented on the y-axis. Each log entry is represented as a point on the graph, with its position indicating the time of occurrence and its size or color indicating the severity or count of logs at that point in time.
you might use a logs timeline graph to:
- Monitor the frequency and severity of errors or exceptions over time, helping you identify recurring issues or areas for improvement.
- Track the performance of a specific component or subsystem, helping you identify bottlenecks or areas of high activity.
- Detect security incidents or anomalies, such as spikes in failed login attempts or unauthorized access attempts.
- Analyze user behavior, such as tracking the frequency and duration of user sessions or identifying usage patterns across different devices or platforms.
Log search bar
It allows you to search through logs data for specific keywords or phrases. The Search Bar is located at the top of the Logs Viewer area of the screen and provides a quick and easy way to find logs related to a particular issue or event.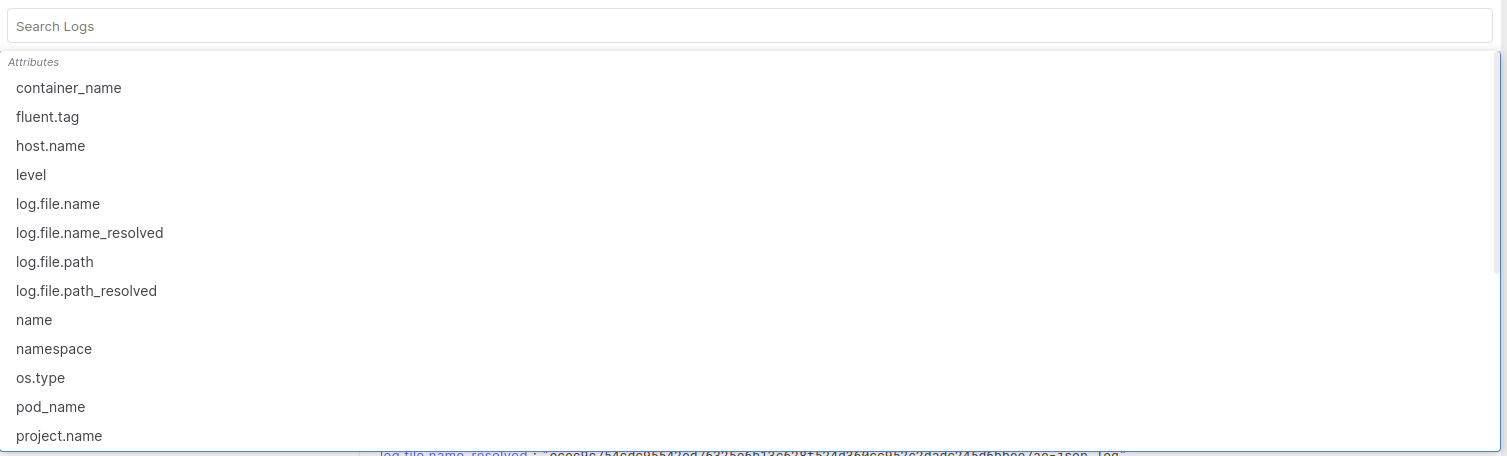 The Search Bar offers a variety of search options, including simple keyword search, advanced search, and full-text search capabilities. Search Bar also includes autocomplete and suggestions based on the logs data.
You might use the Search Bar to:
The Search Bar offers a variety of search options, including simple keyword search, advanced search, and full-text search capabilities. Search Bar also includes autocomplete and suggestions based on the logs data.
You might use the Search Bar to:
- Find logs related to a specific user, IP address, or other identifier.
- Search for error messages, warning messages, or other types of log entries.
- Look for logs related to a specific date or time range.
- Filter logs based on specific criteria, such as severity level, source, or application component
Log FingerPrints
It allows you to identify unique patterns or signatures and similar or related logs within log data, making it easier to diagnose issues and optimize system or application performance. Logs Fingerprints work by analyzing the content and structure of log entries, looking for patterns such as error messages, timestamps, or other identifiers. Once a fingerprint is identified, it can be used to group together similar log entries. For example, if you were monitoring a web server and noticed a sudden spike in error logs, you might use Logs Fingerprints to identify all logs related to that error, grouping them together based on shared characteristics such as timestamp, error message, or user agent. This could help you quickly identify the cause of the error and take steps to resolve the issue.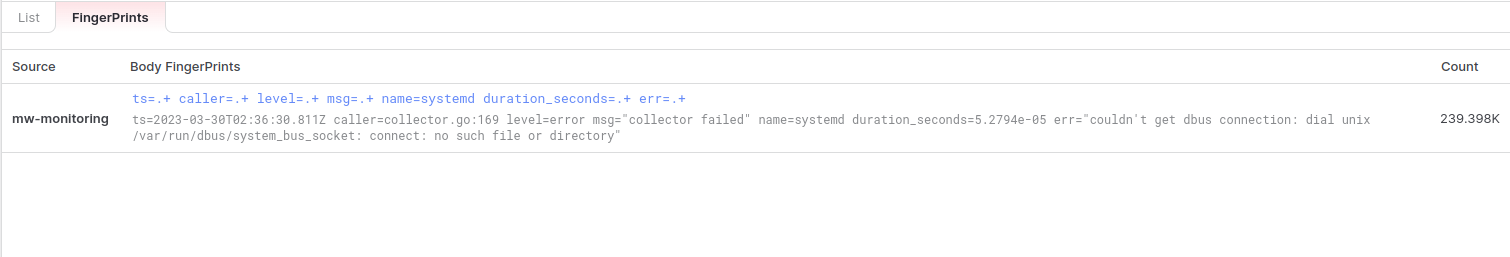
Log Filters
It allows you to filter log data based on specific criteria or attributes. Logs Filters offer a variety of filtering options, including search by keyword, date range, severity level, source, application component, or other attributes. Filters may be applied individually or in combination, allowing you to fine-tune your logs data to meet your specific needs.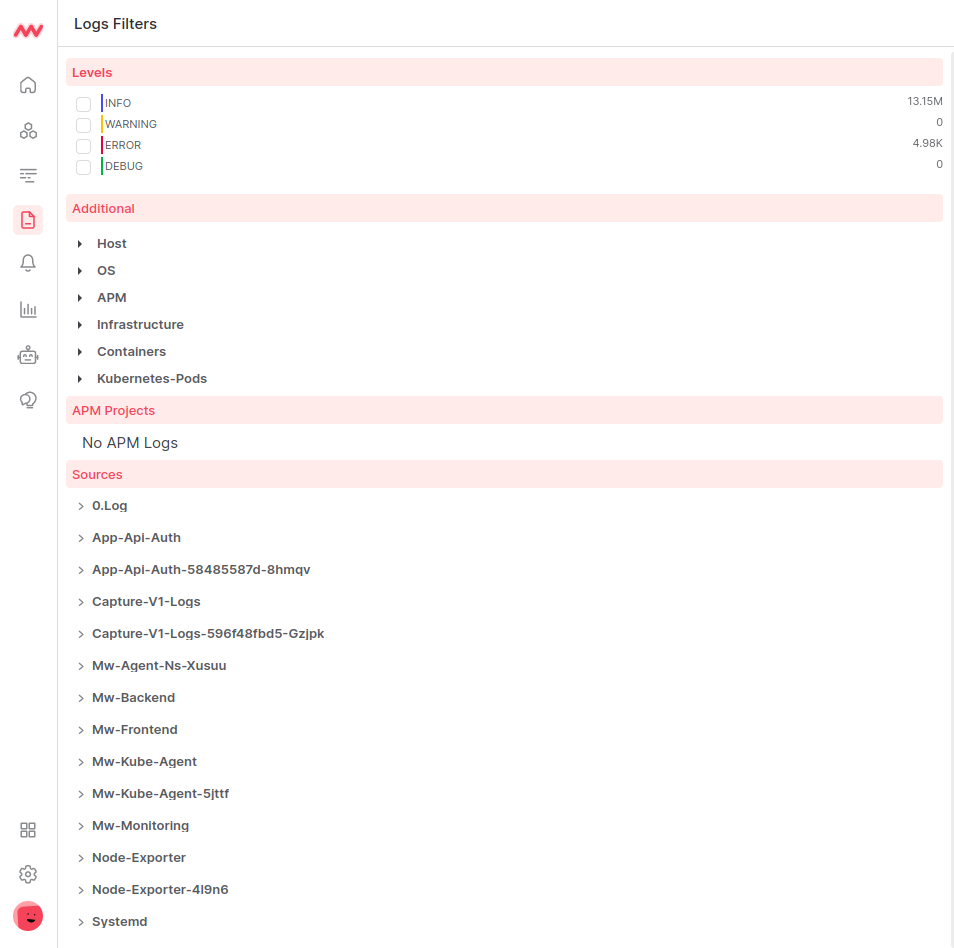 The filters are Divided into 4 Parts:
- Level Based Filters
- Some Additional filters for Identifying logs for OS, Hosts, Docker, Kubernetes
- APM Projects for Logs belonging to Applications
- Source Filters for filtering logs based on their sources
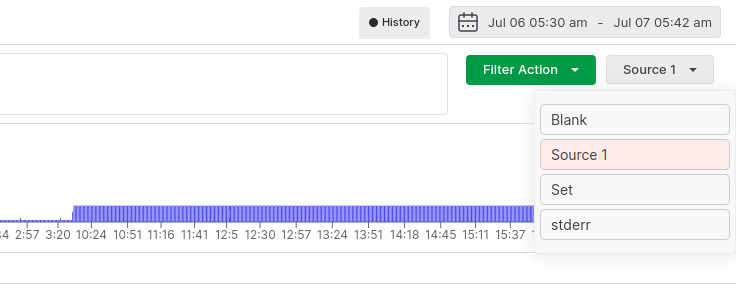
Logs Workbook
It allows you to save frequently used filters for later use and quickly access commonly used filters without having to recreate them each time. You can create and Select workbooks from the action menu at the right of the logs search bar.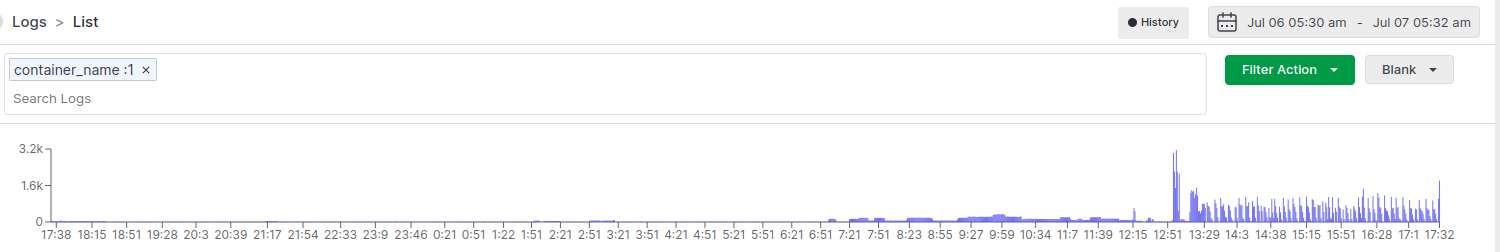 To use Logs Saved Filters, you first need to create a filter based on your criteria or attributes, as you would with a regular filter. Once you have created your filter, you can save it with a descriptive name, making it easy to identify and access later.
Saved filters can be accessed By selecting from the rightmost action menu On Selection the logs data will be automatically filtered based on the saved criteria or attributes. .
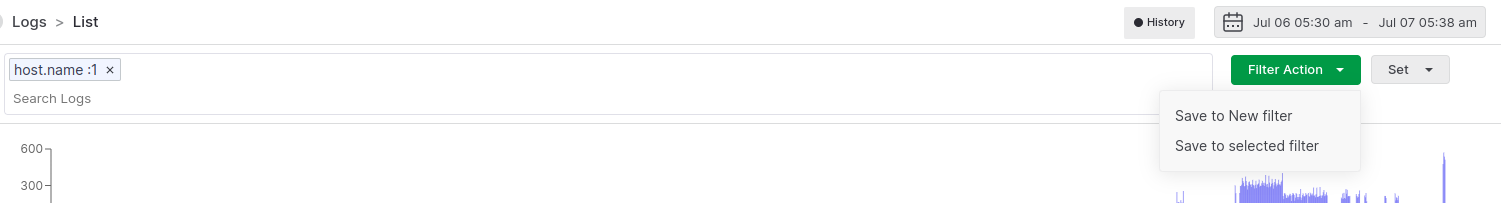
 You can create more filters for different attributes and save them in a different workbook or same workbook by selecting Save to New Filter or Save to Selected Filter.
Live and Historical Logs
In Logs Monitoring screen, it allows you to switch between a real-time or live view and a static or historical view of the logs data. When the Toggle Live button is turned on, the Logs Monitoring screen will continuously update with the latest logs entries, giving you a real-time view of system or application activity (if there is no log data in live stream, then the last available logs will display). You can search for historical logs using the date and time picker from the right corner of the log listing. Need assistance or want to learn more about Middleware? Contact us at support[at]middleware.io.