For more information on drilling into your logs, navigate to Drilling Into Your Data.
Log Properties
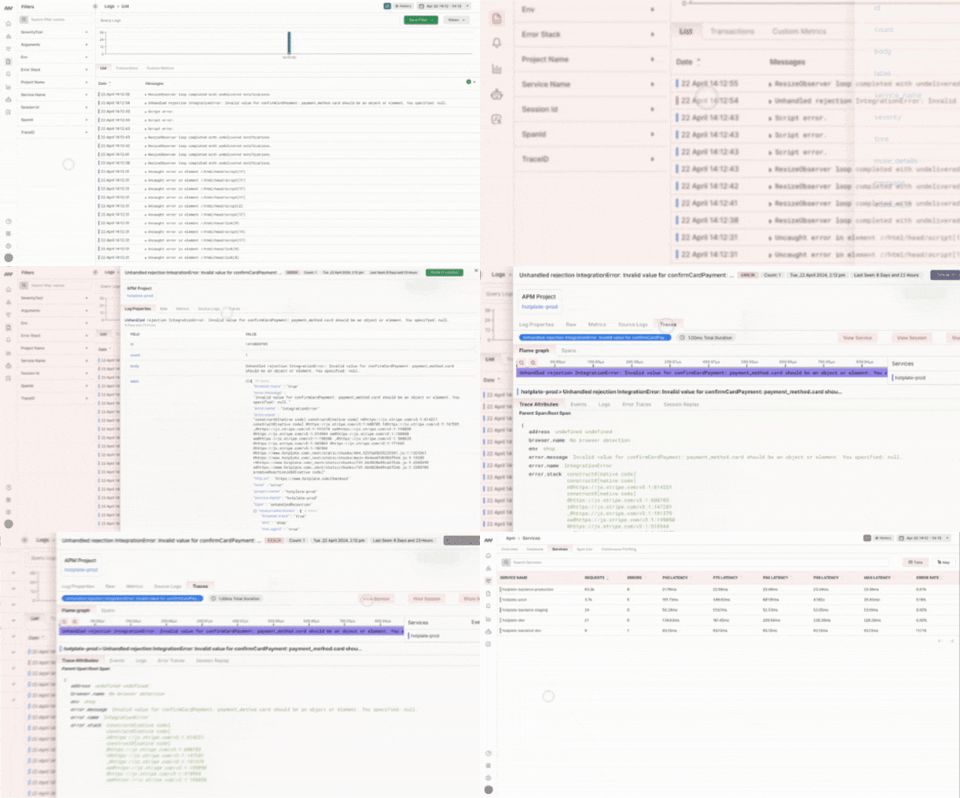
The Log Properties section displays a componentized version of your raw JSON object:Raw
The Raw section displays the JSON object for the specific log entry you are drilling into:Metrics
Within the Metrics section, there are three separate tabs relating to Host, Process, and Container data.Host
The Host section displays all of your host data about the host the log came from. This tab is useful for identifying usage, network connection, and memory usage by state, and disk input/output on a per-host basis.Process
The Process section displays all the processes related to the host the log came from. This tab is useful for identifying CPU, physical, and virtual memory usage on a per-process basis.Container
The Container section displays all of your container data about the host the log came from. This tab is useful for identifying received and transmitted network packets as well as CPU usage on a per-container basis.Source Logs
The Source Logs section displays all of your unprocessed records generated by the underlying components of your infrastructure:Traces
The Traces section displays all of your trace data related to the log you are drilling into. Logs contain an attribute called the trace ID, which correlates trace data to that specific log. Correlating logs with traces is useful for contextualizing larger system-wide issues within your infrastructure. Use the Flame Graph or Span View to understand the flow of trace requests through your system, the distribution of stack errors, and call hierarchies. The View Service and View Trace features (listed below) allow you to drill even further into your logs by contextualizing broader infrastructure issues.View Service
The View Service button takes you directly to the APM Page containing a list of connected services relative to the original log you were drilling into:
View Session
The View Session button gives you the ability to view the Real User Monitoring (RUM) session connected to your log:
Next Steps
- Log Monitoring Overview
- Creating Log Filters
- Custom Metrics
- Transforming Logs into Transactions
- Creating Alerts
- Real User Monitoring (RUM)
Need assistance or want to learn more about Middleware? Contact us at support[at]middleware.io.