Resource Monitoring Alerts
CPU Utilization Alert
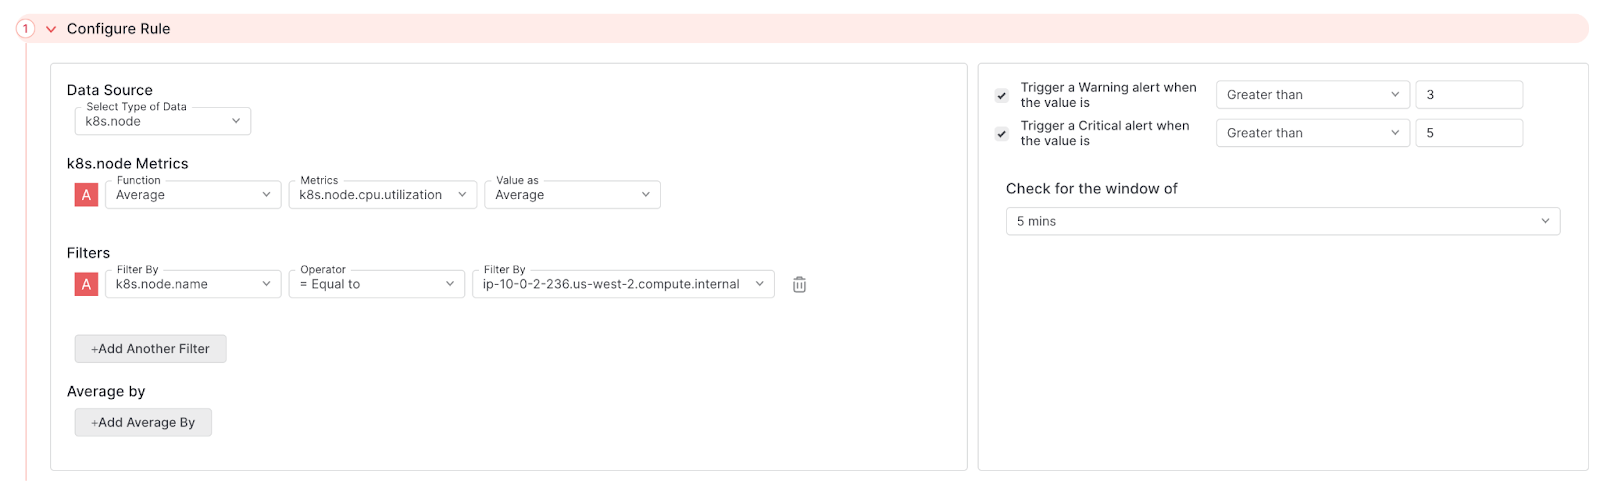
The following alert tracks the average CPU Utilization for a Kubernetes node. This alert is monitoring a single Kubernetes node, specified by the Filter configuration. A Warning alert is fired whenk8s.node.cpu.utilization surpasses an average CPU Utilization of three mCores on the specified Kubernetes node, while a Critical alert is triggered when k8s.node.cpu.utilization surpasses an average CPU Utilization of five mCores. This is checked on a five minute interval.
Memory Consumption Alert
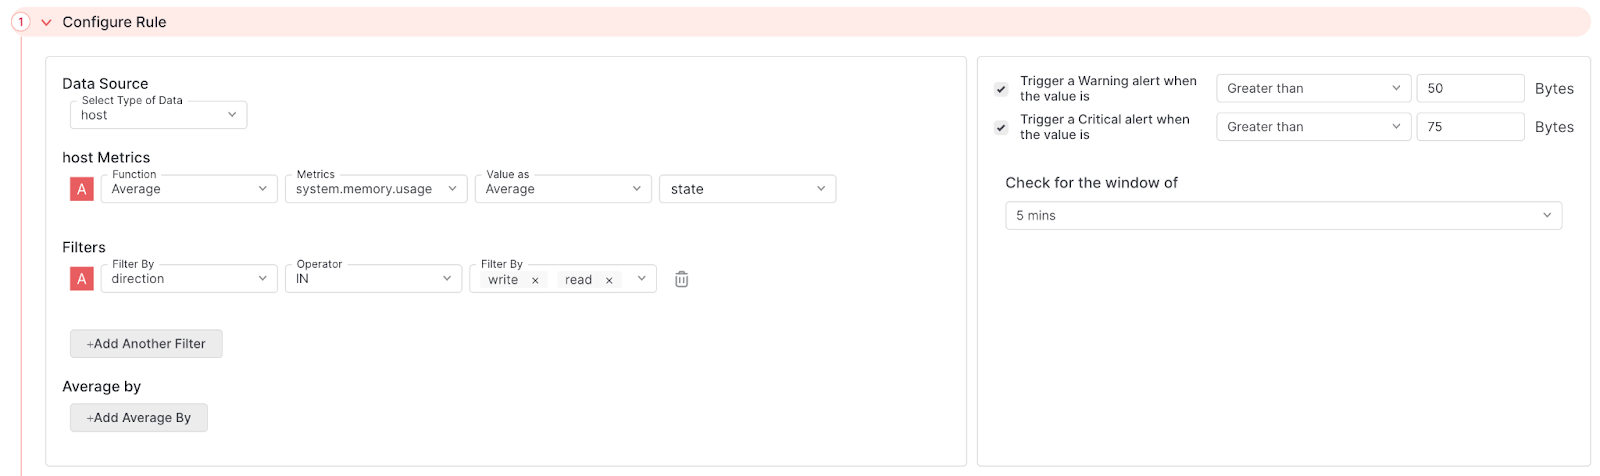
The following alert tracks the average amount of memory used when data is being read and written across your entire system. A Warning is fired whensystem.memory.usage is greater than 50 bytes and a Critical warning when it is greater than 75 bytes. This is checked on a five minute interval.
The State filter is left blank so that all state metrics (e.g. buffered, cached, free, etc.) are collected.
APM Monitoring Alert
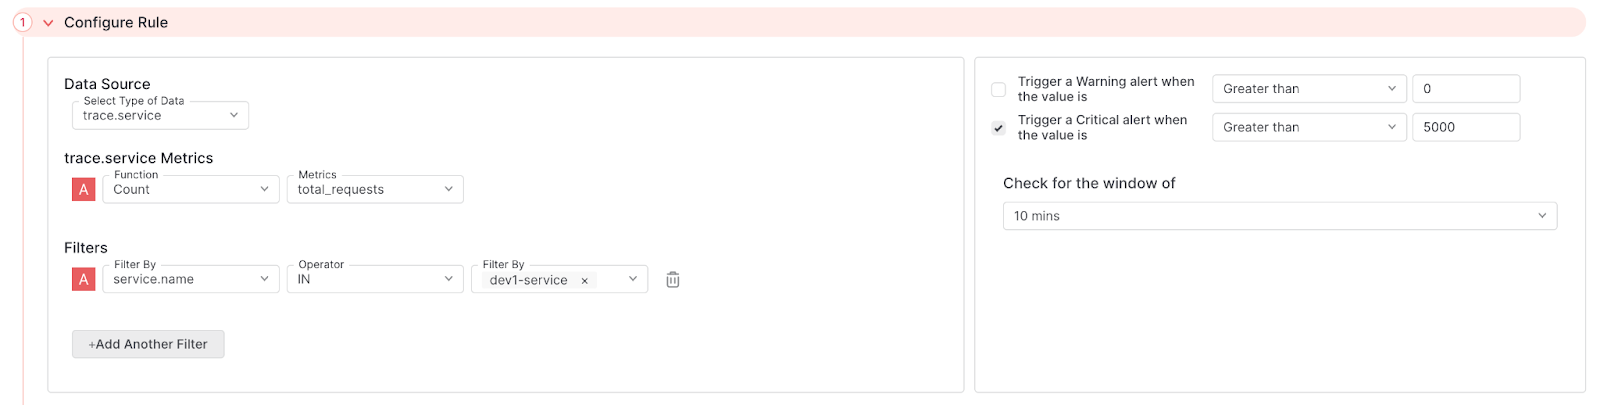
The following alert tracks the total number of trace requests from a single APM. This alert uses theIN operator to monitor a specific service.name with the Filter configuration. A Critical message is fired when the total number of trace requests exceeds 5,000 in a 10 minute period.
Log Error Alerts
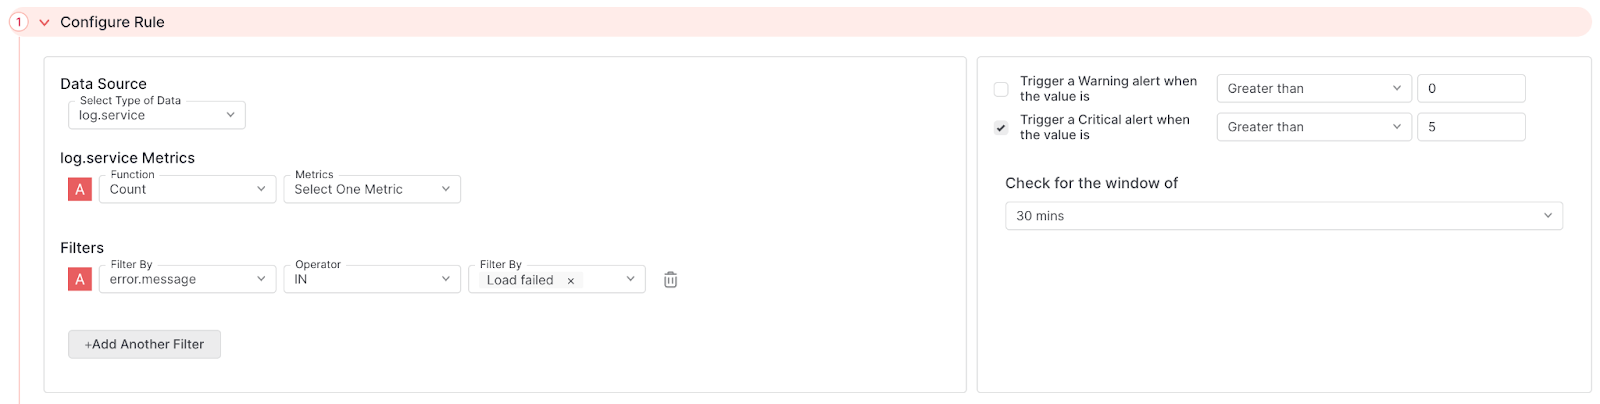
The following alert tracks the total number of logs that contain a message indicating a load failure. This alert uses theIN operator to monitor error.message with the Filter configuration. A critical message is fired when there are more than five error.message that contain the string Load Failed in a 30 minute window.
Need assistance or want to learn more about Middleware? Contact us at support[at]middleware.io.