This integration is only supported for users with the default
AllowAllAuthenticator authentication permissions. Prerequisites
Middleware Host Agent (MW Agent) must be installed on your local machine. To install the MW Agent, see our Installation Guide.Setup
Step 1: Access Integrations
Login to your Middleware account, navigate to the Installations page in the bottom left corner, select All Integrations and click Cassandra: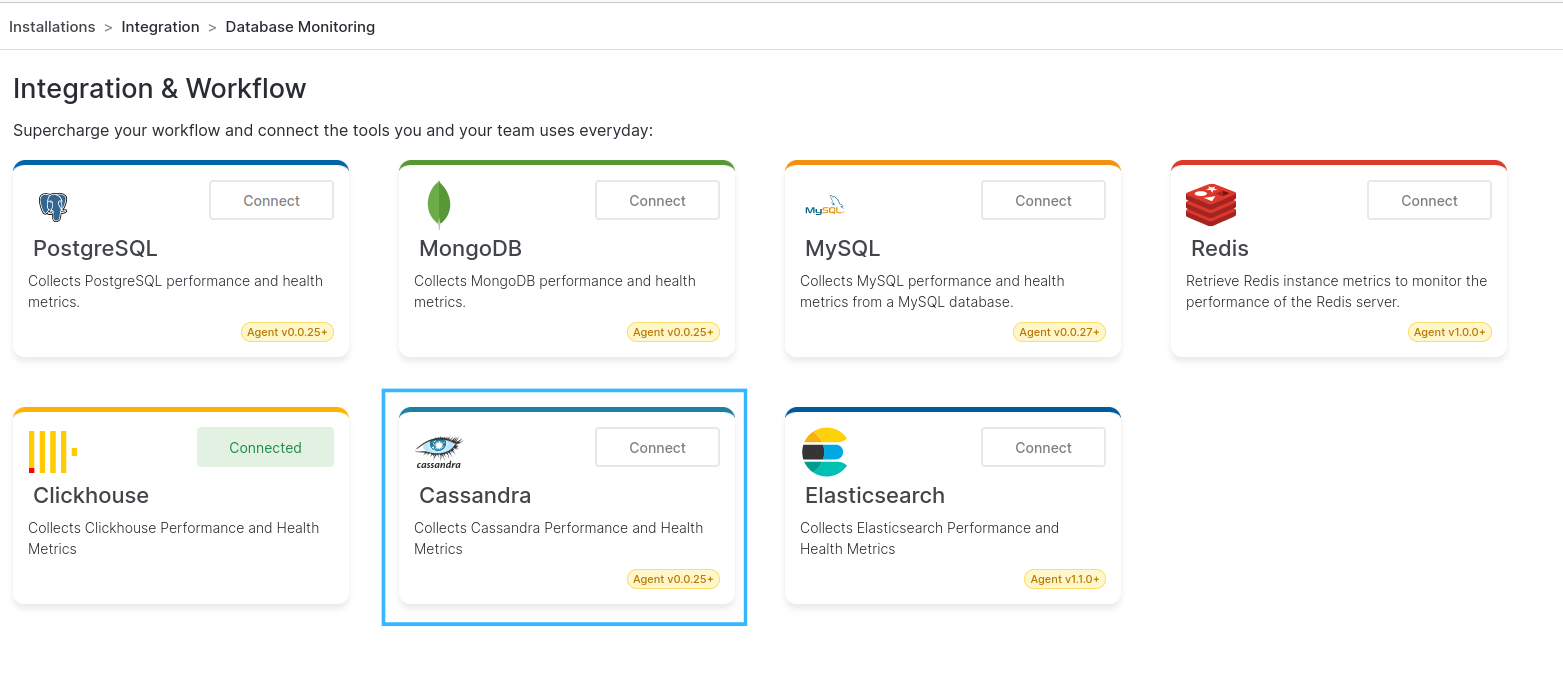
Step 2: Connect Cassandra Instance
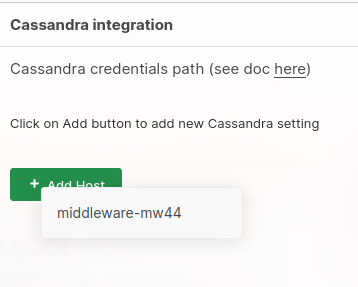
To access Cassandra metrics, choose a host to connect to your Cassandra Cluster:Hosts will only show up in this list if they have a running Host Agent
Step 3: Configure Your Host
Configure your host to connect to the IP address and JMX port of your Cassandra Cluster: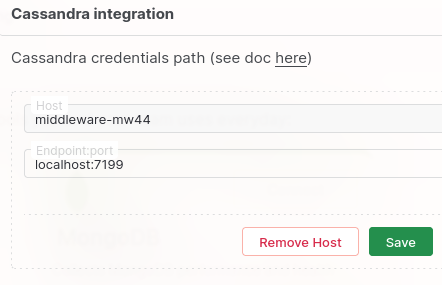
The default port for your Cassandra instance is
7199 Visualize Your Data
Default Cassandra Dashboard
Quickly access your Cassandra data with Middleware’s default Cassandra dashboard. Navigate to the Dashboard Builder and select the Cassandra - Metrics Dashboard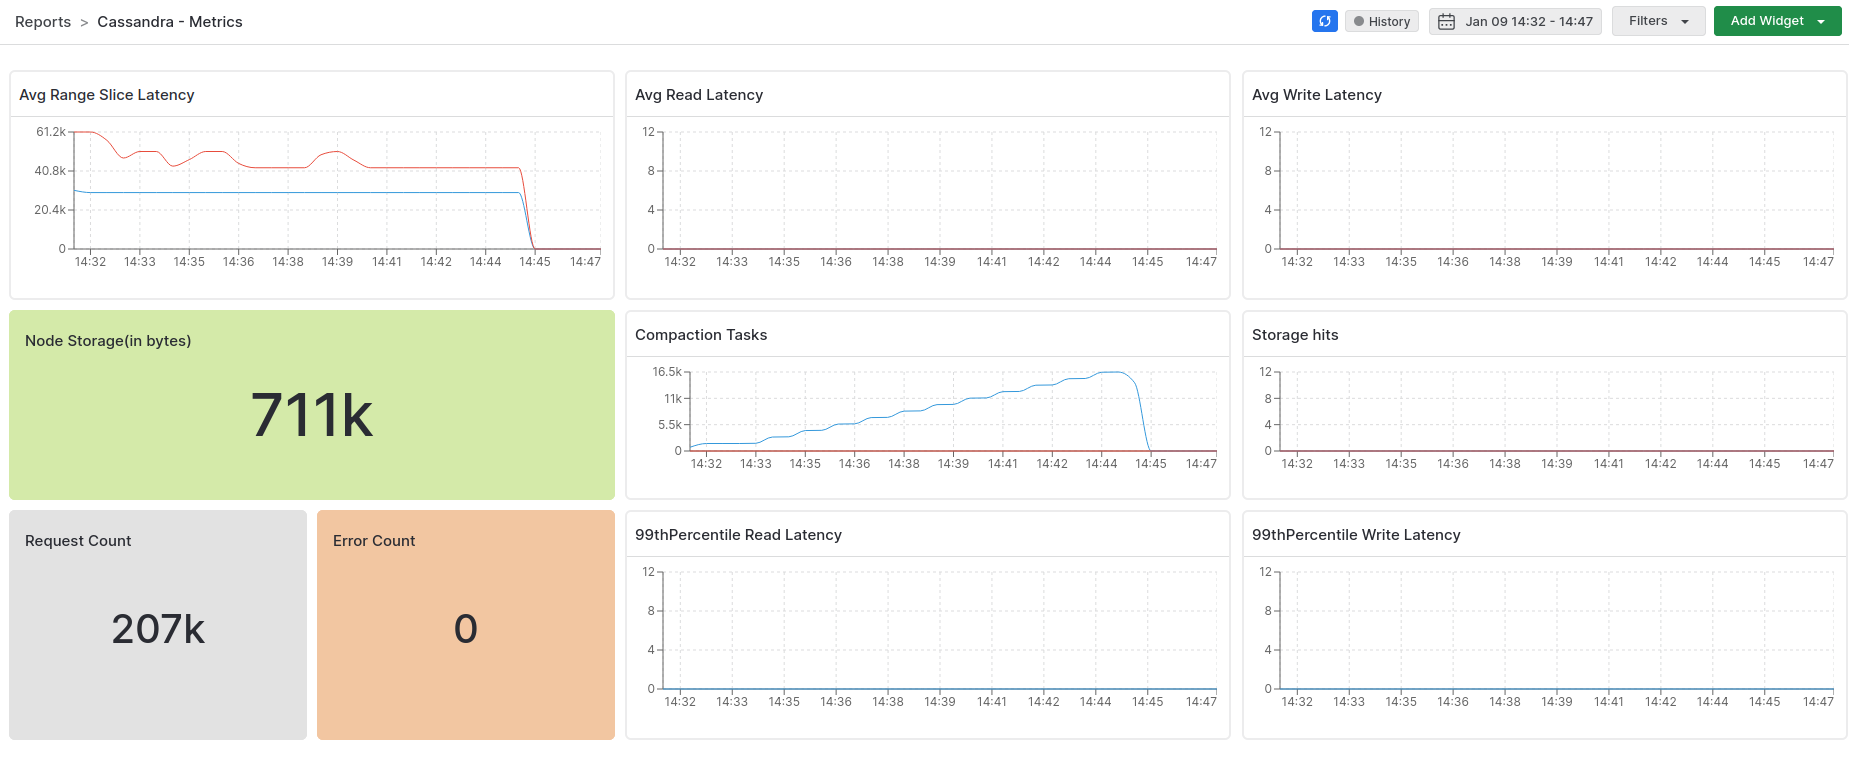
Create Cassandra Widgets
Create your own widget from scratch. Navigate to the Dashboard Builder and select the dashboard you would like to create a widget in. Select Add New Widget and choose the cassandra data source.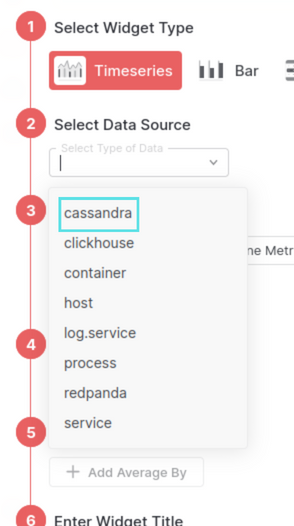
Learn more about creating your own widgets and dashboards in the Dashboard Builder section.
Metrics Collected
| Metric | Description |
|---|---|
cassandra.client.request.count | Total count of client requests |
cassandra.client.request.error.count | Count of errors that occurred during client requests |
cassandra.client.request.range_slice.latency.50p | 50th percentile latency for range slice requests |
cassandra.client.request.range_slice.latency.99p | 99th percentile latency for range slice requests |
cassandra.client.request.range_slice.latency.max | Maximum latency for range slice requests |
cassandra.client.request.read.latency.50p | 50th percentile latency for read requests |
cassandra.client.request.read.latency.99p | 99th percentile latency for read requests |
cassandra.client.request.read.latency.max | Maximum latency for read requests |
cassandra.client.request.write.latency.50p | 50th percentile latency for write requests |
cassandra.client.request.write.latency.99p | 99th percentile latency for write requests |
cassandra.client.request.write.latency.max | Maximum latency for write requests |
cassandra.compaction.tasks.completed | Count of completed compaction tasks |
cassandra.compaction.tasks | Current count of compaction tasks |
cassandra.storage.load.count | Count of storage loads |
cassandra.storage.total_hints.count | Total count of hints stored |
cassandra.storage.total_hints.in_progress.count | Count of hints currently in progress |
Troubleshooting
Missing Integrations Menu
Missing Integrations Menu
Next Steps
- How to Create Alerts
- Dashboard Basics & Customization
- Custom Telemetry Ingestion
- Getting Started With Real User Monitoring (RUM)
- Data Ingestion APIs
Need assistance or want to learn more about Middleware? Contact us at support[at]middleware.io.