Prerequisites
Middleware Host Agent (MW Agent) must be installed on your local machine. To install the MW Agent, see our installation guide.Setup
Step 1: Create Database Credentials
Create a.yaml file containing database credentials like the below example. If the database is not password protected, the username and password fields can be removed.
/home/ubuntu/redis-creds.yaml
.yaml
For Docker users, create the credentials yaml file in the
/var/log directory. Step 2: Access Integrations
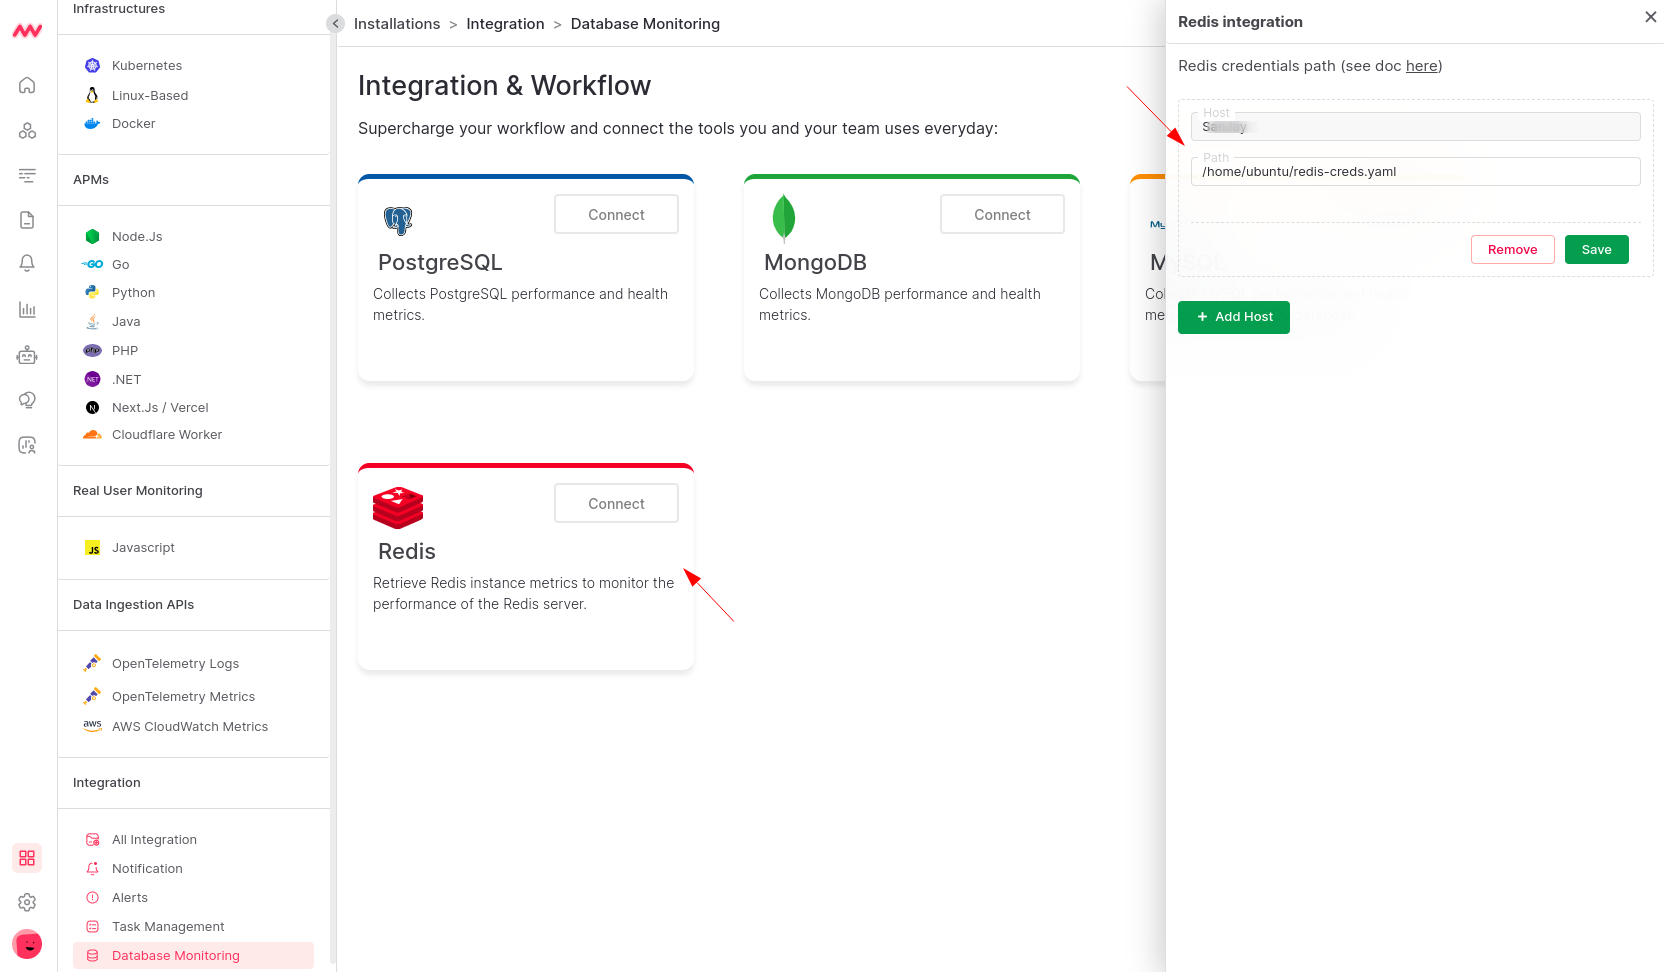
Log in to Middleware, navigate to the Installations Page in the bottom left corner, select All Integration and click Redis
Step 3: Enable Integration
Add a host machine from the dropdown list, input the credential path from Step 1, and SaveVisualize Analytics
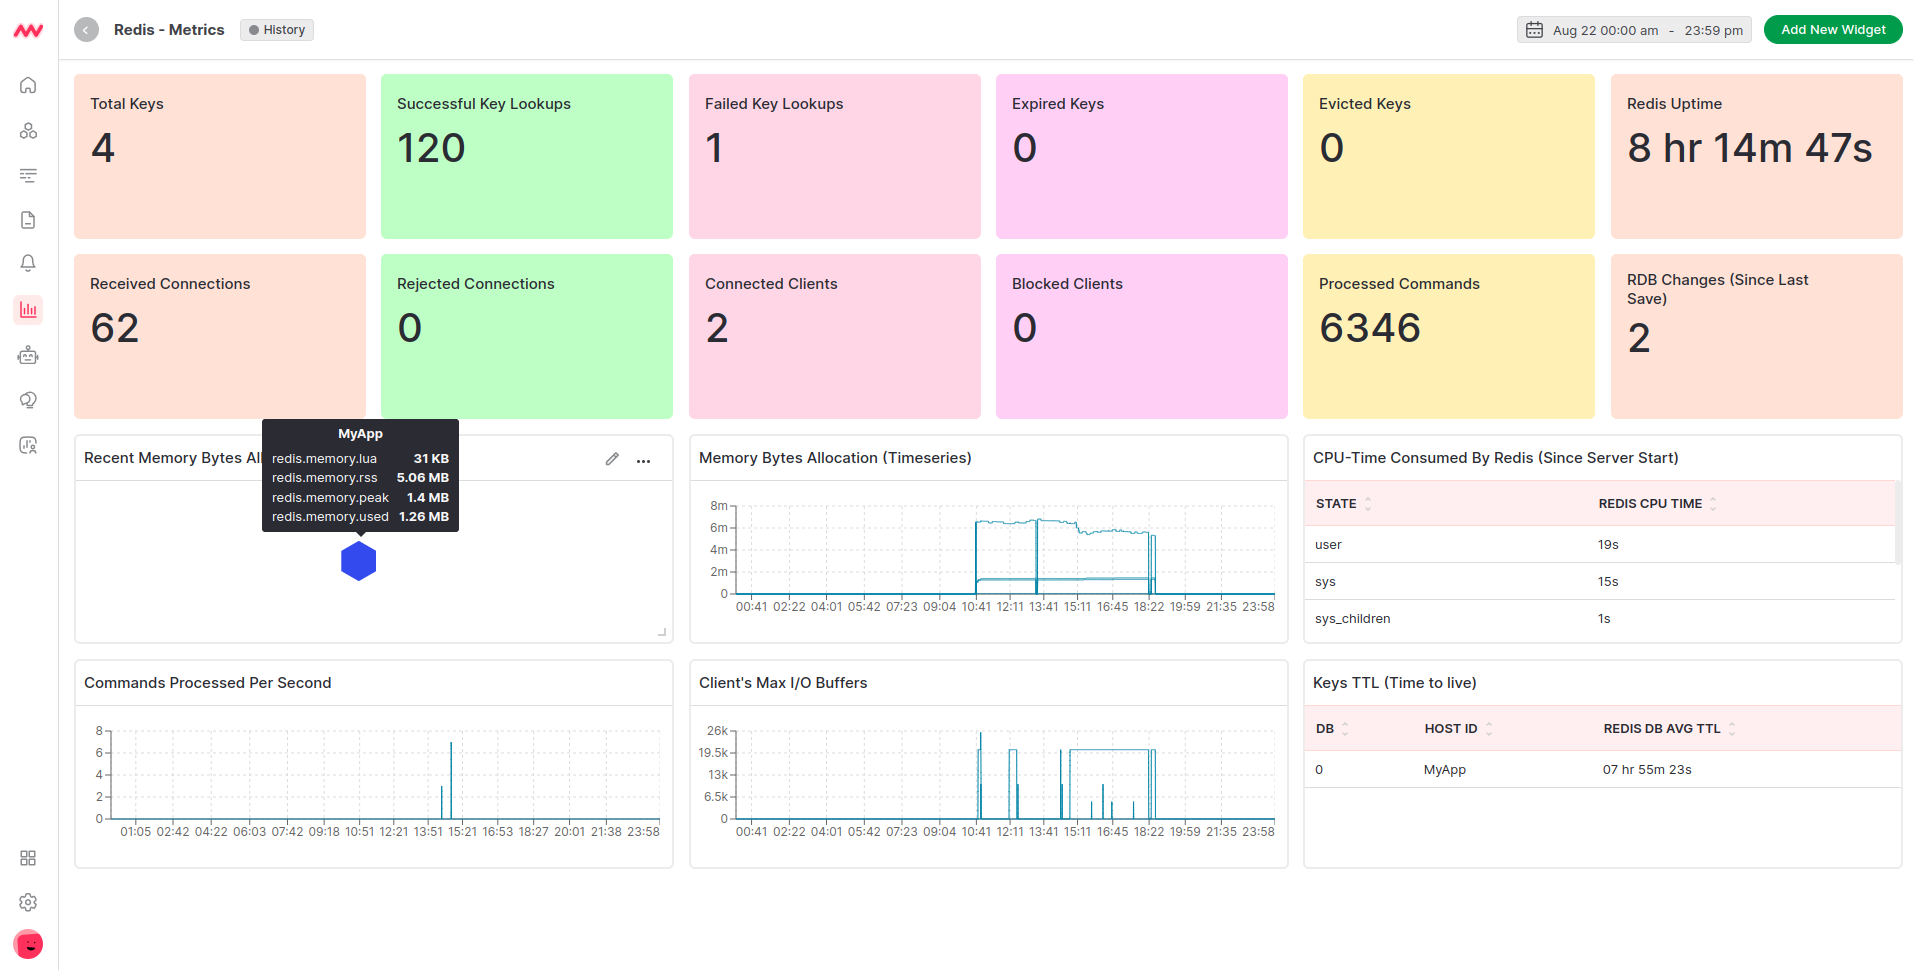
Default Redis Dashboard
Once the Redis integration setup is complete, a new Redis-specific dashboard will appear in the Dashboard Builder. This default dashboard serves as a jumping off point for visualizing and analyzing Redis data.
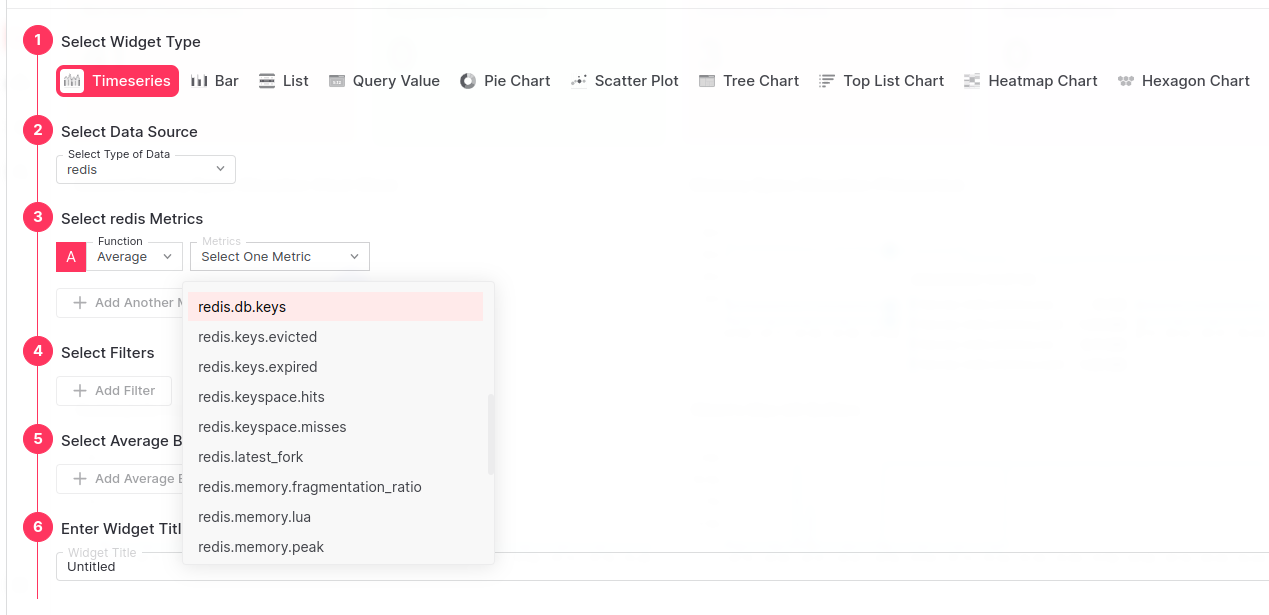
Create Redis Widget
Redis data can be added to dashboards as a custom widget. When adding a new widget, select theredis data source to view a full list of available Redis data.

Alerts
Alerts can be configured for any Redis metrics. When creating a new rule select the Database detection method and Redis database type for available metrics to appear in the Metrics dropdown list. Select the desired metric and continue configuring the alert conditions.Metrics Collected
| Metric | Description |
|---|---|
redis.maxmemory | Configured maxmemory value |
redis.role | Lists node’s role |
redis.cmd.calls | Total number of calls for a command |
redis.cmd.usec | Total time for all executions of this command |
redis.uptime | Number of seconds since server start |
redis.cpu.time | System CPU consumed by server since start |
redis.clients.connected | Number of client connections, excludes connections from replicas |
redis.clients.max_input_buffer | Largest buffer of current client connections |
redis.clients.max_output_buffer | Longest output list of current client connections |
redis.clients.blocked | Number of clients pending a blocking call |
redis.keys.expired | Total number of key expiration events |
redis.keys.evicted | Number of keys evicted due to maxmemory limit |
redis.connections.received | Number of connections accepted by the server |
redis.connections.rejected | Number of connections rejected due to maxclients limit |
redis.memory.used | Total bytes allocated by Redis |
redis.memory.peak | Historical max bytes consumed by Redis |
redis.memory.rss | Bytes allocated from operating system |
redis.memory.lua | Bytes used by the Lua engine |
redis.memory.fragmentation_ratio | Ratio between memory.rss and memory.used |
redis.rdb.changes_since_last_save | Number of changes since latest dump |
redis.commands | Number of commands processed per second |
redis.commands.processed | Total number of commands processed by the server |
redis.net.input | Total number of bytes read from the network |
redis.net.output | Total number of bytes written to the network |
redis.keyspace.hits | Number of successful key lookups in main directory |
redis.keyspace.misses | Number of unsuccessful key lookups in main directory |
redis.latest_fork | Duration of latest fork operation in microseconds |
redis.slaves.connected | Number of connected replicas |
redis.replication.backlog_first_byte_offset | Master offset of the replication backlog buffer |
redis.replication.offset | Current offset of the replication server |
redis.db.keys | Number of keyspace keys |
redis.db.expires | Number of keyspace keys with an expiration |
redis.db.avg_ttl | Average keyspace keys time to live |
Troubleshooting
Missing Integrations Menu
Missing Integrations Menu
Next Steps
- How to Create Alerts
- Dashboard Basics & Customization
- Custom Telemetry Ingestion
- Getting Started With Real User Monitoring (RUM)
- Data Ingestion APIs
Need assistance or want to learn more about Middleware? Contact us at support[at]middleware.io.